The EIA released the latest edition of their Electric Power Monthly on September 25th, with data for July 2018. The table above shows the percentage contribution of the main fuel sources to two decimal places for the last two months and the year to date.

(Click to enlarge)

(Click to enlarge)
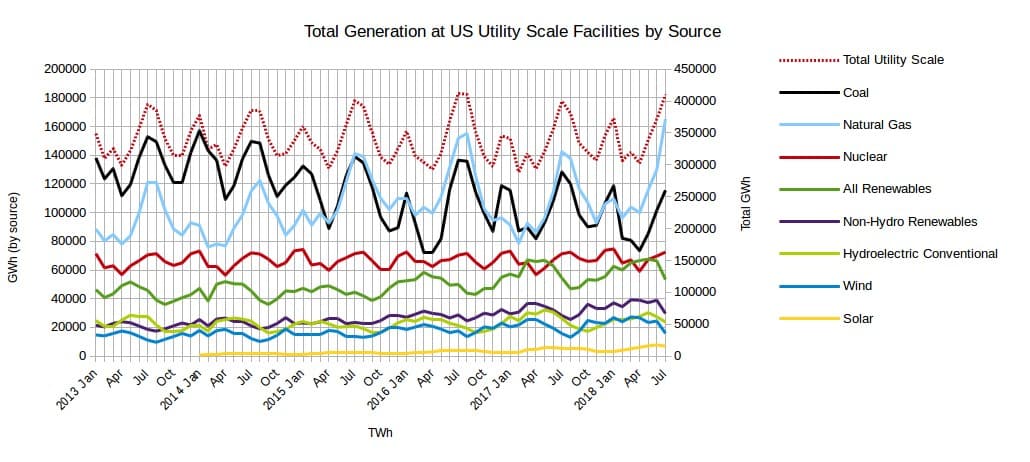
For the month of July, the total amount of electricity generated was the second highest amount generated for any single month since January 2013 at 410,148 GWh, 2,302 GWh less than the amount generated in July 2016. Coal and Natural Gas fueled almost 68.5 percent of US electricity generation in July and while the contribution from Coal increased from 27.36 percent in June to 28.18 percent in July, the contribution from Natural Gas also increased by slightly more than five percentage points, reaching an unprecedented 40.28 percent up from 35.02 percent in June. Nuclear power generated 72,456 GWh, 3.97 percent more than it did in June but, due to the increase in total generation, the percentage contribution to the total actually declined to 17.67 percent from 18.77 percent in June.
In July, the contribution from All Renewables at 13.01 percent fell further below that from Nuclear at 17.67 percent, similar to July 2017 when the ramp up of total generation resulted in the percentage contribution from All Renewables falling further below that from Nuclear. The absolute contribution from Solar declined from it’s all time high in June of 10,880 GWh to 10,049 GWh, with the corresponding percentage contribution declining to 2.45 percent as opposed to 2.93 percent in June. The amount of electricity generated by Wind decreased by almost 35 percent, from 24,411 GWh to 15,897 GWh and coupled with the increased total generation, the percentage contribution declined from 6.58 percent to 3.88 percent in July. The contribution from Hydro decreased 13.53 percent from 27415 GWh in June to 23706 GWh, resulting in the percentage contribution decreasing from 7.39 percent in June to 5.78 percent. The combined contribution from Wind and Solar decreased to 6.33 percent from 9.51 percent in June. Consequently the contribution from Non-Hydro Renewables also decreased to 7.23 percent from 10.48 percent. The contribution of zero emission and carbon neutral sources, that is, nuclear, hydro, wind, solar, geothermal, landfill gas and other biomass decreased to 30.68 percent from 36.64 percent in June. Related: The No.1 Pitfall For Oil Prices
The graph below helps to illustrate how the changes in absolute production affect the percentage contribution from the various sources.
(Click to enlarge)
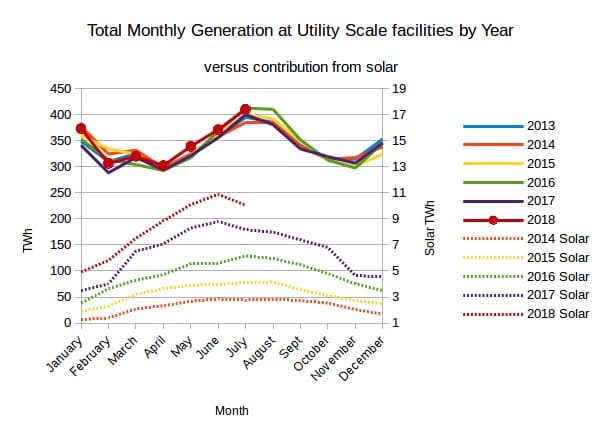
The chart below shows the total monthly generation at utility scale facilities by year versus the contribution from solar. The left-hand scale is for the total generation, while the right hand scale is for solar output and has been deliberately set to exaggerate the solar output as a means of assessing it’s potential to make a meaningful contribution to the midsummer peak. The scale on the y axes has been adjusted to display TWh instead of GWh as suggested by Dennis (Coyne) earlier this year to make the comparison a little easier. In July 2018 the output from solar at 10,049 GWh, was 3.64 times what it was four years ago in July 2014. Solar energy appears to have peaked in June, the month of the summer solstice, so it is looking like the peak monthly output for 2018 is likely to be 10,880 GWh, barring the remote chance that more is generated in August.
(Click to enlarge)
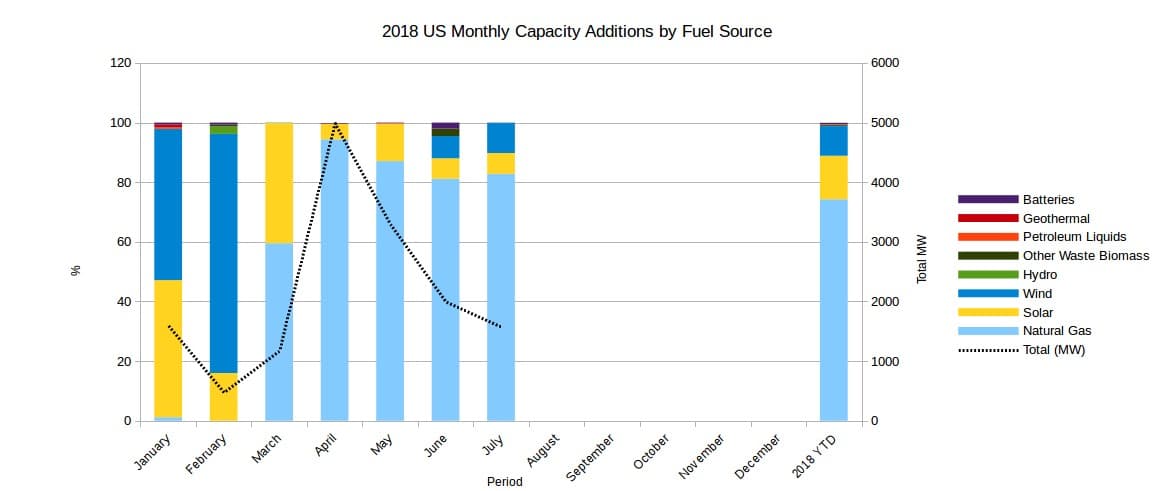
The chart below shows the monthly capacity additions for 2018. In July Natural Gas contributed 82.78 percent of new capacity. With 7.45 percent of new capacity coming from Wind and Solar contributing 6.85 percent, Natural Gas, Solar and Wind made up almost 99.94 percent of new capacity in July.
Related: Saudi Arabia To Splash $20B On Oil Capacity Boost
The only capacity added that is not fueled by Natural Gas, Wind or Solar was a 1MW cogen plant, fueled by Distillate Fuel Oil (at the Loma Linda University. In July 2018 the total added capacity reported was 1,576 MW, compared to the 1,667 MW added in May 2017.
(Click to enlarge)
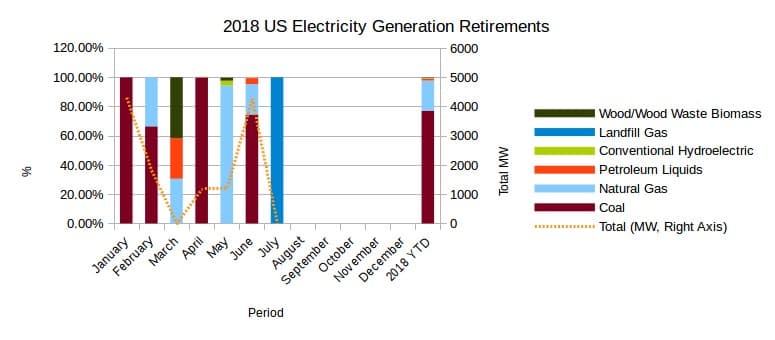
The chart below shows the monthly capacity retirements so far for 2018. In July the only retirements were three units powered by internal combustion engines, fueled by Landfill Gas, two 1 MW units in Maryland and a 1.7 MW unit in Texas, for a total of 3.7 MW.
ADVERTISEMENT
(Click to enlarge)
Following the report on the edition of the EPM with data for March, there was some discussion about coal consumption for the production of electricity.
By Peak Oil Barrel
More Top Reads From Oilprice.com:
- Big Oil Is Back On A Spending Spree
- Rig Count Inches Lower As Oil Prices Stabilize
- EIA Report Threatens Oil Price Rally


To reduce the need to burn fossil fuel during peak electric power production in the summer, additional solar capacity helps. Hopefully we can build more solar. Solar cost is still falling and we always have he prospect of a significant breakthrough.