There is a reason for raising interest rates to try to fight inflation. This approach tends to squeeze out the most marginal players in the economy. Such businesses and governments tend to collapse, as interest rates rise, leaving less “demand” for oil and other energy products. The institutions that are squeezed out range from small businesses to financial institutions to governmental organizations. The lower demand tends to reduce inflationary pressure. The amount of goods and services that the world’s economy can produce is largely determined by fossil fuel supplies, plus our ability to use “complexity” in many forms to produce the items that the world’s growing population requires. Adding debt helps add complexity of various types, such as more international trade, more advanced education, and more specialized tools. For a while, the combination of growing energy supplies and growing complexity have helped pull economies along.
Unfortunately, the world’s oil supply is no longer growing. Without an adequate oil supply, it becomes difficult to maintain complexity because complex solutions, such as international trade, require adequate oil supplies. Inasmuch as we seem to be reaching energy and complexity limits, nothing the regulators try to do to change the debt and money supply–even reeling them back in–can fix the underlying oil (and total energy) problem.
I expect that the rich countries of the world, including the US, Europe, and Japan, are in line to be adversely affected by high interest rates this time. With their high levels of complexity, they are among the most vulnerable to disruption when there is not enough oil to go around.
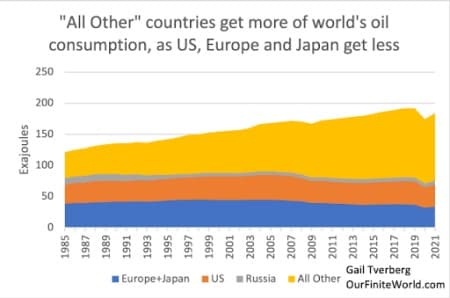
Figure 1. World oil consumption divided into consuming areas, based on data of BP’s 2022 Statistical Review of World Energy. Europe excludes Estonia, Latvia, Lithuania, and Ukraine.
The problem I see is that rich countries expect to maintain service economies that are fed by huge streams of manufactured goods and raw materials from poorer countries. This pattern appears unsustainable to me, in a world with falling exports because of energy problems.
I expect a significant change in the trading of goods and services, starting as soon as the next few months. Major financial changes may be ahead, fairly soon, as well. In this post, I will try to explain these and related ideas.
[1] Growing debt is a temporary substitute for growing energy supply of the right kinds.
Economists seem to believe that the economy grows because of an invisible hand. I believe that the economy grows because of a growing supply of energy products of the right kinds, together with a growing supply of other raw materials, and a growing supply of human labor. The economy grows in keeping with the laws of physics.
Debt does help provide an extra pull, however, because it enables growing “complexity.” Even in the days of hunters and gathers, it was helpful for people to work together and share the benefit of their labor. A type of short-term debt results from the delayed benefit of working together, even if the delay is only a few hours.
Related: Inventory Draws Across The Board Push Oil Prices Higher
In modern times, debt can help build a factory. The factory can provide more/better output than individual people working by themselves using available resources. There needs to be a way of paying for the delayed benefit of the human labor involved in the whole chain of events that leads to the finished output. Growing debt can help pay workers, long before the benefit of the factory becomes available.
Debt can also make high-priced goods more affordable. A car, or a home, or a college education is more affordable if it can be paid for in installments, as income becomes available to pay for it.
[2] Diminishing returns on added complexity is one issue that puts an end to the ability to grow debt.
As an example, we are slowly discovering that it doesn’t make sense to provide everyone with a university education. Yes, advanced education is of benefit to a percentage of the population, but, in general, there are not enough jobs that pay sufficiently well for it to make economic sense to provide advanced education for everyone who would like to attend college. If debt is provided to finance everyone who applies for advanced education, there are likely to be many loans that can’t be repaid.
As another example, long supply lines can provide cost savings for a manufacturer, but if there is a disruption in any necessary raw material, the whole manufacturing operation may need to be temporarily suspended. The high cost of such a suspension may encourage shorter supply lines or the provision of more stored inventory.
[3] US total debt as a percentage of GDP already seems to be hitting a limit, quite possibly related to diminishing returns on added complexity.
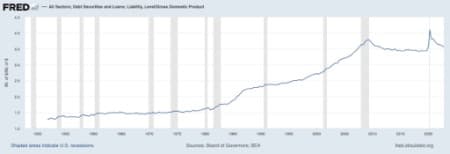
Figure 2. Ratio of US total debt for all sectors to GDP in a chart by the Federal Reserve of St. Louis. Amounts are on a quarterly basis, through 2022.
Figure 2 shows that the US ratio of debt to GDP started increasing shortly after 1980. This was about the time that Ronald Reagan became President in the United States, and Margaret Thatcher became Prime Minister in the UK. There was a need to get energy costs down, and growing debt was one of the tools used to accomplish this. With added debt, new types of hopefully less expensive electricity generation could be added, using debt. Electricity producers were encouraged to compete with each other. The new approach led to less concern about providing adequate upkeep for transmission lines. California is one state where this approach is starting to catch up with the electricity system. Costs are rising, and reliability is falling.
Figure 2 shows that the ratio of US debt to GDP hit a maximum in 2008. An even loftier level was reached in 2020 because of the debt added at the time of Covid-related shutdowns. Now, however, the system doesn’t seem to be able to maintain the high debt level. The quarterly analysis used in Figure 2 highlights how quickly the added debt rolled off.
Analyzing US debt to GDP ratios by sector provides some insight regarding the reason for the fall in the ratio of debt to GDP since 2008 in Figure 2. (The amounts used in Figure 3 are on an annual basis, rather than a quarterly basis, so the shape of the graph is a little different from that in Figure 2.)
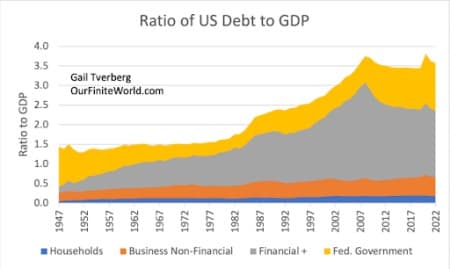
Figure 3. Annual data showing US ratios of debt to GDP by sector. Amounts for debt from Households (which includes not-for-profits, such as churches), Business Non-Financial, and Federal Government are from the Federal Reserve of St. Louis database. Financial+ is calculated by subtraction. Financial+ will also include other small categories, such as the debt of state and local governments.
Figure 3 shows that the category I call Financial+ Debt has played an amazingly large role in the growth of total debt. One of the issues bringing about the 2008-2009 Great Recession was defaults related to Collateralized Debt Obligations (CDOs) and Collateralized Debt Swaps (CDSs), involving debt that had been cut into layers and resold. Various tranches of this debt would then default, as the economy slowed. It became clear that this approach to adding debt was very risky. The elimination of some of this type of debt is likely one of the reasons for the drop-off in Financial+ debt after 2008.
It also becomes clear that there are interactions among the different types of debt. Back in 1947, Federal Debt related to World War II had begun dropping off. To provide civilian jobs for all the people who had served in the war effort, it was helpful to add other debt. More recently, the big run-up in debt of the Federal Government seems to have taken place, partly to try to offset the huge loss of debt in the Financial+ category.
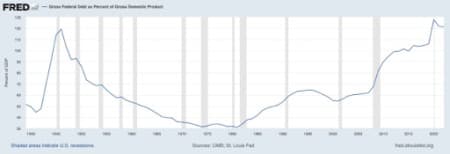
Figure 4 shows the gross debt of the Federal Government, relative to GDP, on an annual basis.
Figure 4. Gross Federal Debt as a Percentage of GDP, on an annual basis, in a chart prepared by the Federal Reserve of St. Louis. Amounts are through 2022.
The gross debt of the Federal Government is now at a higher level than it was when the Federal Government borrowed money to fight World War II! Part of the rise may very well be the need to keep total indebtedness high, to prop up the economic system in general, and energy prices in particular.
[4] In previous posts, I have shown that oil prices seem to be very sensitive to manipulations of the Federal Reserve.
In Figure 5, below, I also make the point that the popping of a debt bubble can cause oil prices to fall precipitously. With the high level of debt that the world economy has today, major defaults are a worry. Because of this concern, central banks today seem willing to bend over backwards to prop up failing banks. If any substantial number of banks are propped up, this will add to inflationary pressure.
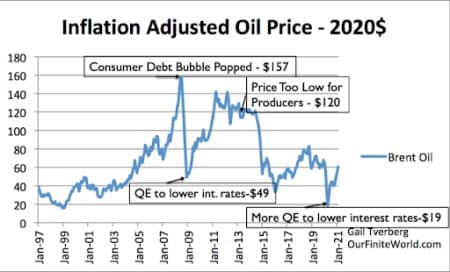
Figure 5. Figure I prepared in early 2021, based on EIA monthly Brent Crude Oil spot oil prices, together with notes added at that time.
Another point that Figure 5 makes is the importance of high oil prices for producers, and the importance of low oil prices for customers. A big part of today’s conflict with respect to oil supply has to do with the affordability of the oil supply, and the fact that such affordable prices for consumers tend to be too low for producers. For example, the European union has attempted to pay Russia for oil at $60 per barrel, partly to hurt Russia, but also to try to bring costs down to a more affordable level. Oil producers tend to cut back supply, as OPEC has recently agreed to do, when prices fall too low.
[5] One thing that people forget in trying to find substitutes for oil is that any substitute must be inexpensive if it is to be affordable. They also forget that they need to consider the cost of required changes to the entire system in any cost estimate.
We often see cost estimates for wind energy and solar energy that consider only the cost of the generation of intermittent electricity. Unfortunately, an economy cannot operate on intermittent electricity. At this point, there isn’t a single island that can operate its electricity system solely on renewables (including hydroelectric energy, in addition to wind and solar).
In theory, a very high-cost electrical system could be put together using some combination of long-distance transmission lines, batteries, and overbuilding, to try to have enough electricity available for periods of low production. But even this would not fix the problem that arises because the world’s agricultural system is mostly powered by oil, not electricity. We cannot get along without food.
If electricity were to be used for the agricultural system, at a minimum, we would need to figure out how to transition all the machines used in fields to use electricity, rather than oil. We would also need to figure out what to do about products that are manufactured using the chemical products that we get from oil, such as herbicides and pesticides. Natural gas or coal is often used to produce ammonia fertilizer. If all fossil fuels are eliminated, a new approach to ammonia production would be needed, as well.
[6] Natural gas cannot be counted on as an inexpensive fuel for a transition to renewables.
Some people hope that a ramp up in natural gas production can be used to help substitute for oil, and thus aid in any transition. A problem that many people are not aware of is the fact that shipping natural gas over long distances as LNG is very expensive. A calculation I saw a few years ago indicated that when LNG was shipped from the US to Europe, adding shipping costs roughly tripled the cost of the natural gas.
Part of the high-cost problem is the need for a huge amount of infrastructure. Natural gas sold as LNG must be compressed, transported at very low temperatures in specially made ships, and then brought back to a gaseous state at the other end. Pipelines are needed at both ends. There is also a need for inter-seasonal natural gas storage because natural gas is often used for heating in winter.
With this huge amount of infrastructure, there is a need for debt to finance all the pieces. When interest rates increase, the result is particularly expensive for those planning to produce LNG for overseas shipment. Such high overhead costs are likely to discourage the building of new LNG export facilities unless long-term contracts at high prices can be obtained in advance.
[7] A huge amount of today’s debt relates to plans to transition to renewables. If these plans cannot work, many debt defaults are certain.
Almost certainly, massive amounts of debt obligations are destined for default if the transition to renewable energy is not successful. The very existence of such liabilities can be expected to lead to widespread problems. Some of this debt will be held by banks; other debt has been issued as bonds or by derivative financial instruments. Pension funds would be badly affected by bond defaults. Derivative financial instruments are likely of many types. Some seem to back exchange traded funds (ETFs).
Young people who have spent thousands of dollars to pursue specialized degrees in fields directly or indirectly related to renewable energy will find that their investment has mostly been wasted. They will not be able to repay their student loans, a large proportion of which is owed to the US Federal Government.
[8] In fact, student loans in general are likely to be a problem for repayment.
The problem with student debt extends beyond students who obtained their training, planning to go into the field of renewable energy. In fact, many former students in fields other than renewable energy are already finding that they cannot repay their student loans because there are not enough jobs available that pay sufficiently high compensation. Also, some individuals who took out the loans were not able to finish their courses of study, so they did not gain the skills needed to secure higher-paying jobs. These individuals, in particular, have problems with repayment.
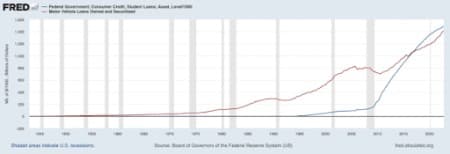
Figure 6. Comparison of the amount of student loans owed to the Federal Government, with the amount of motor vehicle loans, owned and securitized, by financial institutions. Chart by Federal Reserve of St. Louis.
Figure 6 shows that, in total, the amount of student loans debts owed to the Federal Government is about equal to the debt outstanding on motor vehicle loans. Since Covid began, there has been forbearance in debt repayment, but this is likely to end later in 2023. There seems to be a significant chance of defaults starting when this forbearance ends.
It might be noted that there are more student loans outstanding than shown on Figure 6. Besides loans made by the Federal Government, there are also bank loans, amounting to a smaller total.
[9] Falling interest rates since 1980 seem to have played a major role in allowing the US economy to stay on the growth track it has been on.
Up until about 1979, the US economy grew about as quickly as oil consumption, and in fact, growth in total energy consumption. Since 1979, the US economy seems to have grown a little more quickly than consumption of oil or of energy of all types combined.
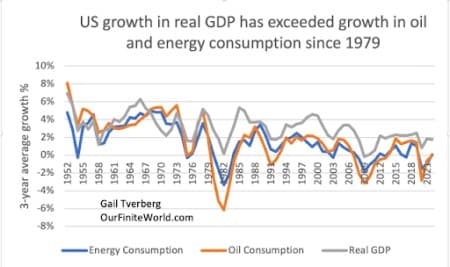
Figure 7. Three-year average growth in real (inflation-adjusted) GDP, based on US BEA data, compared to three-year average growth in oil consumption and total energy consumption, based on US EIA data.
The strange thing that happened around 1979-1981 was a peaking of interest rates on US Treasuries. As I will explain, it was these falling interest rates that indirectly allowed inflation-adjusted GDP to grow faster than oil or total energy consumption.
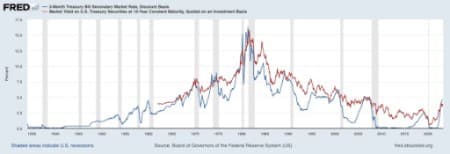
Figure 8. Ten-year and three-month interest rates on US Treasuries through March 27, 2023, in a chart by the Federal Reserve of St. Louis.
Figure 7 shows that during the period 1952 to 1979, consumption of both oil and total energy were (with short interruptions) growing rapidly. The extra oil and other energy could be used to leverage human labor. Thus, productivity could be expected to grow. In fact, the Fed chose to raise interest rates to slow the economy during this period, based on Figure 8.
Higher interest rates on debt would be expected to make monthly payments for buying a home or car more expensive. They would also tend to hold down prices of assets, such as homes or shares of stock, discouraging speculators from trying to make money by investing in homes or shares of stock.
Most of the time since 1980, interest rates have tended to fall. Falling interest rates can be expected to have the opposite effect: They reduce monthly payments for items bought on credit. Because they make homes and factories more affordable, they tend to raise asset values. Also, the existence of more debt encourages more complexity, such as in cases where a large company purchases a smaller one, using debt. Also, as asset prices rise (for example, a rising home price), leaving more equity, there is the temptation to borrow against the newly available equity to buy something else (for example, home furnishings or a boat). Thus, falling interest rates tend to pull the economy forward.
I believe that the indirect impacts of falling interest rates are behind the huge growth in debt, especially in the Financial+ category, seen in Figure 3, above. This debt looks likely to hit even worse default problems than happened in the 2008 era, if interest rates remain high, or rise to even higher levels.
Furthermore, without the support of growing debt, GDP growth is likely to fall back to being equal to the growth in energy or oil supply. If a loss of complexity starts occurring, GDP growth could even start to be smaller than growth in energy or oil supply. Of course, if shrinkage of energy consumption occurs, economies can be expected to contract.
[10] Poorer nations will be able to consume much more oil fuels for themselves if they can push down the consumption of areas that use oil heavily, such as the US, Europe, and Japan.
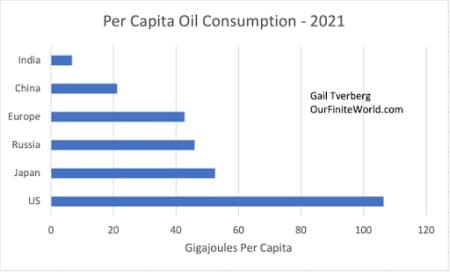
Figure 9. Oil consumption per capita for the areas shown, based on data of BP’s 2022 Statistical Review of World Energy. Europe excludes Estonia, Latvia, Lithuania, and Ukraine.
With their high per capita oil consumption, the combined oil consumption of Europe, Japan, and the United States amounted to almost 38% of total oil consumption in 2021. This can be seen on Figure 1. If this consumption could be brought to zero, the rest of the world could consume about 60% more than they would otherwise.
Of course, the US currently produces most of its own oil, so its oil cannot be obtained unless the US economy collapses to such an extent that it cannot access the oil that it now extracts and refines. As indicated in the introduction to this post, the US is very dependent upon imported goods. Even goods used in the extraction of oil, such as steel pipe used to drill wells and computers, are imported. Furthermore, whether or not problems with imported goods occur, financial problems seem likely in the near future, either caused by collapsing debt, or by the issuance of excessive new governmental debt to try to offset the problem of collapsing debt. Such financial problems are likely to make imports of required foreign goods difficult. Problems such as these might be one way the US loses access to its own oil.
A loss in a “hot” war could also reduce the ability of the US to access its own oil. Poor countries most likely covet the US’s oil resources. In my opinion, the more oil the US leaves in the ground related to climate concerns, the more vulnerable the US becomes to other countries’ trying to access its resources. For most of the world, adequate food supply has priority over climate concerns.
If total world oil supply is shrinking, as seems likely with OPEC cutting its output, poorer countries around the world are now becoming concerned about finding workarounds for this expected oil supply shortfall. One workaround would be for oil exporting countries to reduce their exports to countries that are not their close allies. Another approach would be for the poorer nations of the world to reduce the quantity of oil now used for international transport by cutting back on exports of all types of goods to rich counties.
Changes to the international financial system may be very near. There are now stories about greater cooperation among countries of the Middle East and China. There are also stories about moving away from the US dollar for trade.
[11] I have written in the past about the world self-organizing economy being built up in layers and being hollow inside. We can imagine the loss of Europe, and perhaps the United States and Japan, as being rather like an avalanche, removing some unsustainable parts of the system.
Our economy is a physics-based self-organizing system that looks as if it could keep growing forever.
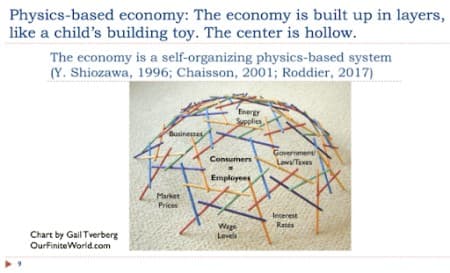
Figure 12. Figure by Gail Tverberg demonstrating how the world economy grows.
As the economy grows, new businesses are added. We can envision them as new layers, added on top of existing businesses. The growing consumer (and worker) base helps push this growth along. At the same time, unneeded products and businesses tend to fall away, making the center of the structure hollow. For example, the world economy no longer makes many buggy whips, since horses and buggies are no longer the primary means of transportation.
Built into this system are financial and regulatory structures, operated by banks and governments. When the rate of growth of the energy supply is constrained, the system starts encountering more debt defaults and banking crises. I think that this is where we are today.
In a way, the economy with all its debt is like a Ponzi Scheme. It depends on a growing supply of energy and other resources to continue to be able to pay back its debt with interest. The higher the interest rate, the more difficult it is to keep the whole arrangement operating.
Something will have to “give,” as the growth in oil supply turns to shrinkage. In theory, what is lost could be the operation of the whole world economy, but the system does seem to hold together, to the extent that it can, if adequate energy supply exists for even part of the global economy. That is why I think that the near-term result may be more of an avalanche than a complete collapse.
We don’t know exactly what lies ahead, but the situation does look worrying.
By Gail Tverberg via Ourfiniteworld.com
More Top Reads From Oilprice.com:
- Citi Doesn’t See $100 Oil Despite Shock OPEC+ Cuts
- The Oil Bulls Are Back On The Attack
- Japan Is Betting Big On Hydrogen


