

 |
Louisiana Light • 4 days | 84.39 | +0.14 | +0.17% | ||
|
Bonny Light • 3 days | 84.45 | -0.41 | -0.48% | ||
|
Opec Basket • 4 days | 84.23 | -2.94 | -3.37% | ||
|
Mars US • 184 days | 77.26 | -1.51 | -1.92% | ||
|
Gasoline • 2 days | 2.555 | -0.041 | -1.59% |

|
Bonny Light • 3 days | 84.45 | -0.41 | -0.48% | ||
|
Girassol • 3 days | 85.44 | -0.34 | -0.40% | ||
|
Opec Basket • 4 days | 84.23 | -2.94 | -3.37% |
|
Peace Sour • 3 days | 72.15 | -0.05 | -0.07% | ||
|
Light Sour Blend • 3 days | 75.20 | -0.05 | -0.07% | ||
|
Syncrude Sweet Premium • 3 days | 82.15 | -0.05 | -0.06% | ||
|
Central Alberta • 3 days | 72.55 | -0.05 | -0.07% |
|
Eagle Ford • 4 days | 75.43 | -0.05 | -0.07% | ||
|
Oklahoma Sweet • 4 days | 75.50 | +0.00 | +0.00% | ||
|
Kansas Common • 6 days | 72.25 | -0.75 | -1.03% | ||
|
Buena Vista • 7 days | 87.60 | -1.22 | -1.37% |

Breaking News:

Clean Energy Sector Ignoring Growing Cybersecurity Threat, Experts Warn
The United States faces an…

Lithium Faces Challenge From Sodium Batteries
Lithium-ion has been the dominant…
"Big Cold Weather Pattern Change" Forecasted For Eastern US

The weather blog Severe Weather Europe provides an in-depth analysis of "cold anomalies across much of the central, southern, and eastern United States" after the start of the new year.
This news should excite our US readers since many of them have been experiencing higher-than-average temperatures due to El Niño.
The influence of the El Nino continues to grow, helping to create a strong Jet Stream pattern over the Pacific Ocean, bringing warmth into North America. But a pattern change is still on course for January.https://t.co/iD0a8DTm2e
— severe-weather.EU (@severeweatherEU) December 14, 2023
* * *
Winter 2023/2024 has begun in a very dynamic way. Currently, we have a strong train of pressure waves across the Pacific and into North America. That will evolve into a strong low-pressure system, driving a powerful jet stream and warmer air over the United States, just to be replaced in early 2024 by a big cold weather pattern change.
A low-pressure area is forecast to develop over the North Pacific in the next few days and will produce a strong jet stream pattern that will push the mild ocean air into North America. But it is not forecast to last long, as proper winter is currently scheduled to arrive in January.
We will first look at the latest weather patterns and the unusual jet stream development forecast. You will also see how Winter is forecast to arrive in January, and we will also look at what is driving the atmosphere from one extreme to the other.
WAVES IN THE ATMOSPHERE
The current weather pattern across the North Pacific and North America is very dynamic. In the image below, you can see the latest pressure anomalies in a wave-like pattern. Such pressure waves are an attempt of the atmosphere to balance out the temperature difference between the cold poles and the warm tropics.
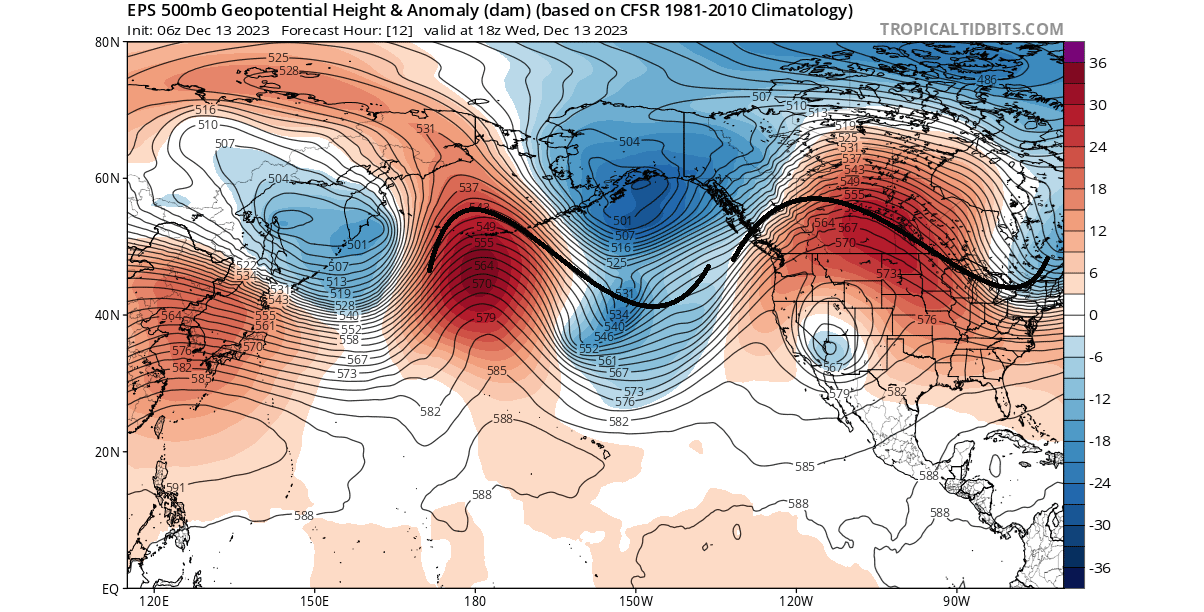
These pairs of pressure systems are also known as Rossby Waves. You can see an example of Rossby waves in the image below by NOAA. As you can see, the current pattern above is quite a textbook example of a Rossby wave train from the Pacific into North America.
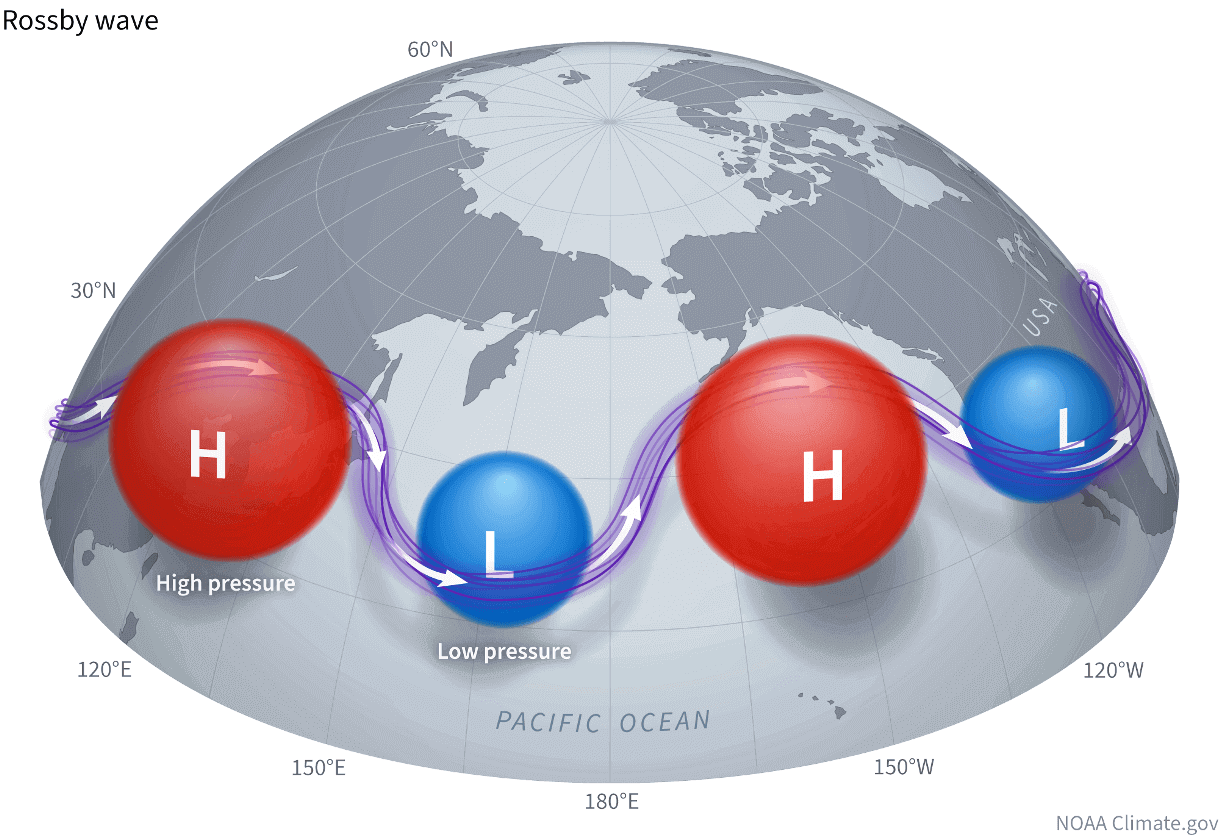
The violet line connecting these pressure systems is the jet stream. It drives and interacts with the pressure systems, thus helping to directly influence our daily weather. That is why any changes in the jet stream are very important to monitor.
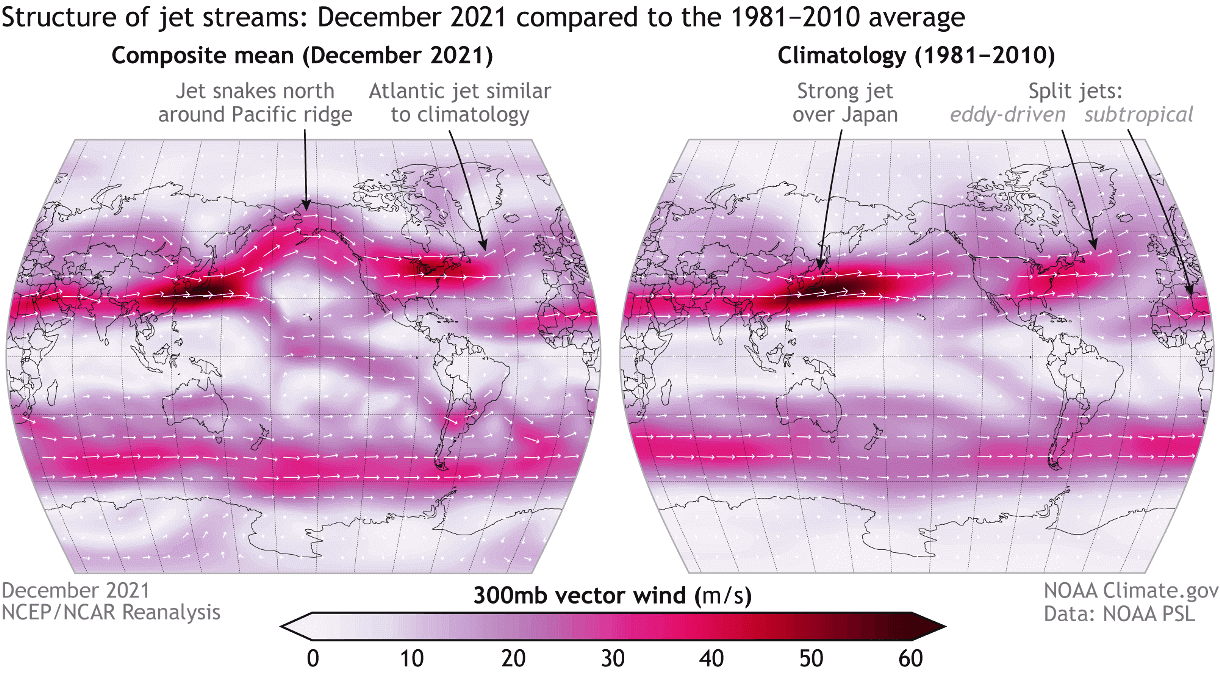
The term jet stream is behind extreme events, from cold spells and flooding to heatwaves and droughts. It is a fast, narrow current of air flowing from west to east that surrounds the globe. In the image below, you can see an example of the global jet stream in a NOAA analysis.
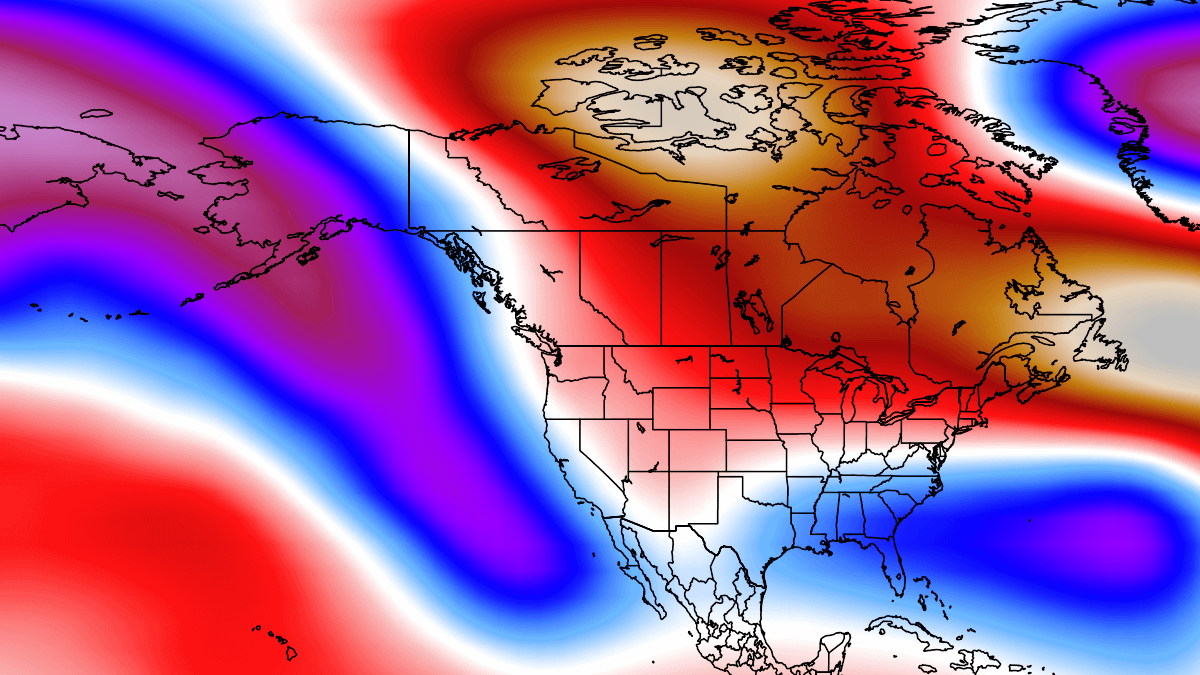
This all comes together if we look at the latest temperature anomalies across the Pacific and North America. Just like with pressure anomalies, you can see the temperature waves of warm and cold zones. As a warm anomaly is present over the northern United States and Canada, a colder-than-normal anomaly is over the northeastern United States.
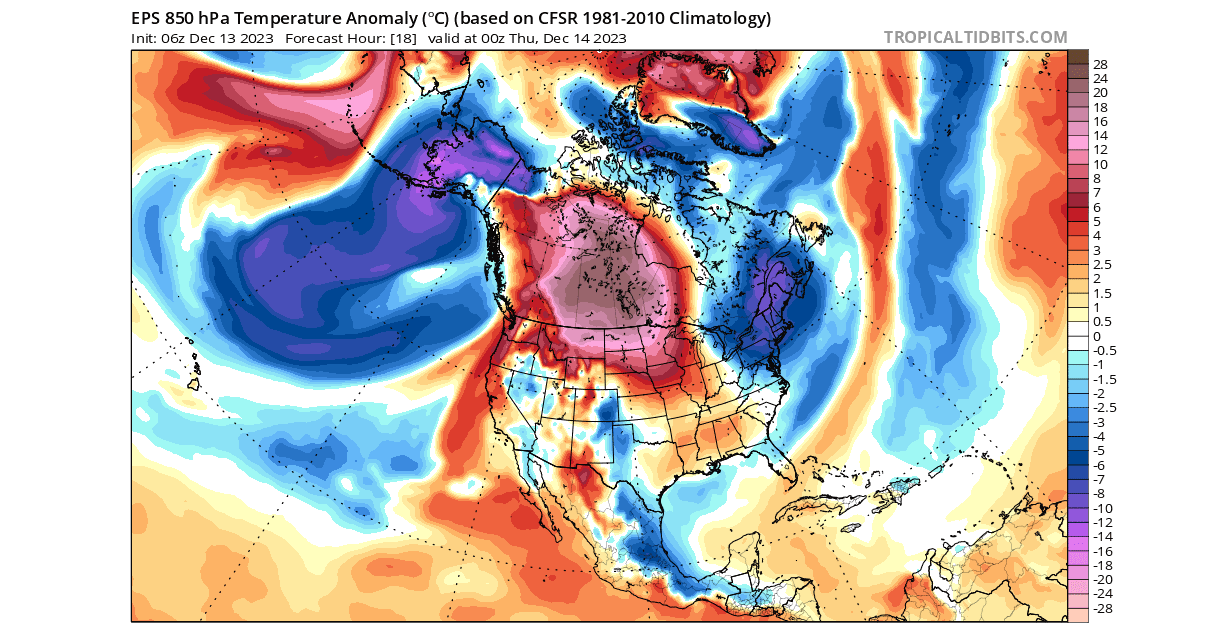
These temperature patterns directly correspond to the high and low-pressure systems and the jet stream that connects them. The strongest cold is usually found when the jet stream is wavy, and these pressure waves are strong, and the low-pressure area of the wave is directly over the United States.
But there is a reason why we are looking at the current pattern and learning about pressure waves and the jet stream.
In the coming days, the dynamic waves in the North Pacific will be replaced by a large and strong low-pressure area, creating a more linear jet stream and having a strong weather impact over the United States and Canada.
AS THE PRESSURE DROPS
During winter, the pressure systems tend to be stronger, especially lows. As there is a lot of energy involved, the weather systems are constantly in motion and interacting with each other. This can bring along pattern changes on a larger scale, one like we are about to see unfold in the second half of December.
The graphics below show the ensemble forecast from the ECMWF data, openly available by the Copernicus data hub. Images are provided by weathermodels.com, using a commercial license.
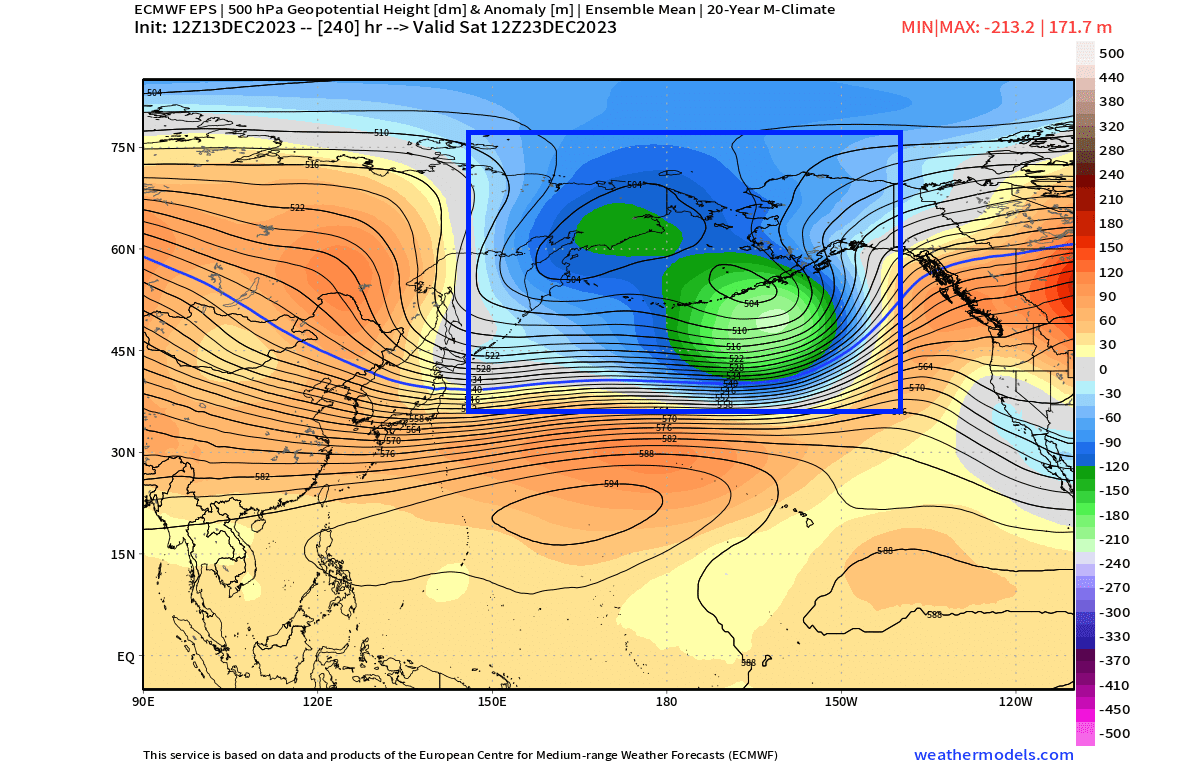
Looking 10 days ahead, you can see in the forecast below that a broad low-pressure area is forecast to develop over the Aleutians. This will replace the usual train of shorter pressure waves and produce a more linear pattern.
This longer wave pattern can be seen in the forecast below for the holidays. You can see a broad low-pressure area over the ocean and a large high-pressure area over North America. This is the same Rossby wave pattern as you saw in the beginning, but in a longer form.
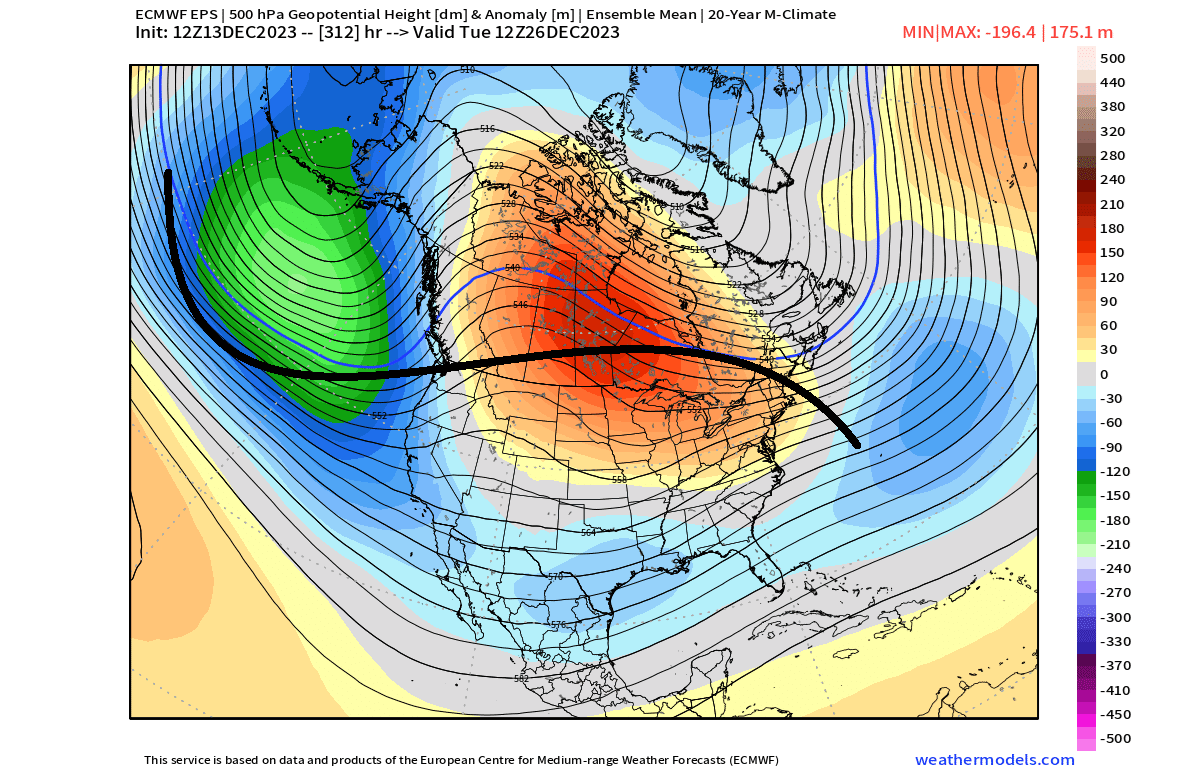
What this does is two things. First, it creates a strong pressure difference. And strong pressure difference means strong winds. This brings strong westerly and southwesterly low-level winds into the western United States and western Canada and, with it, milder ocean air.
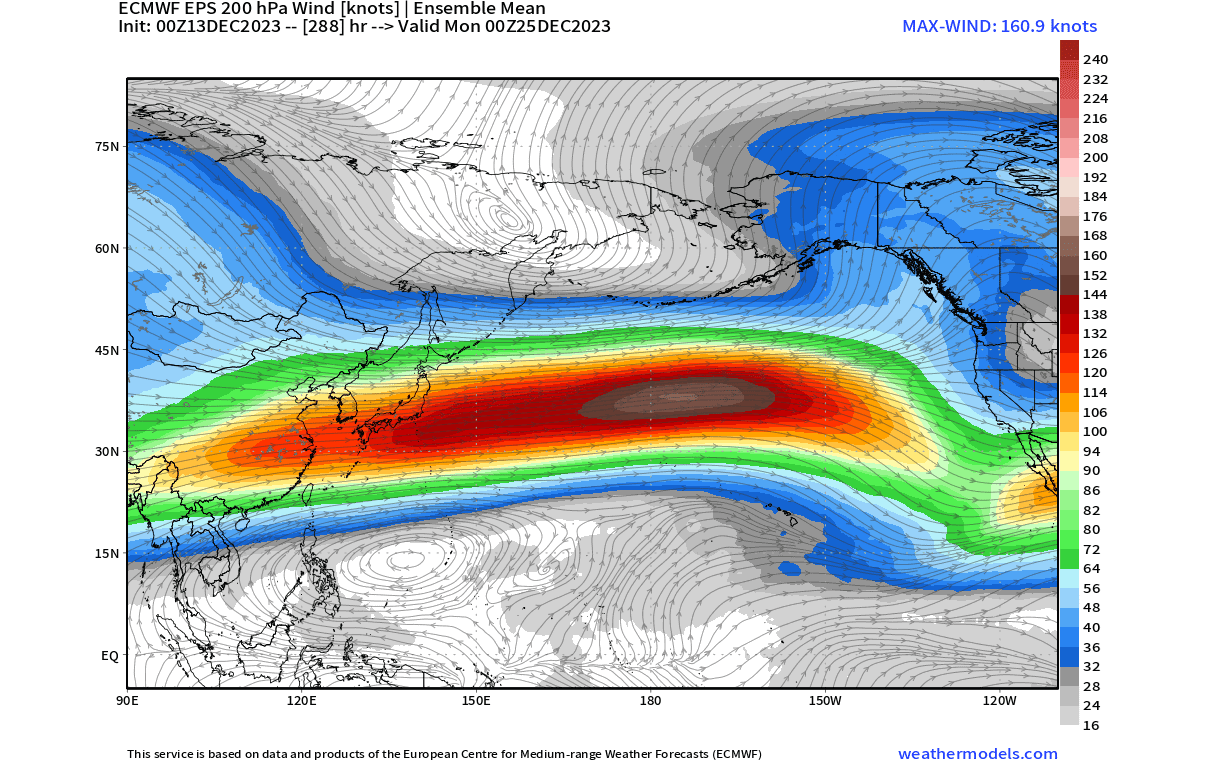
Second, it creates a very strong jet stream in the upper levels. You can see it in the graphic below, showing the wind speed at the 200mb level (12km/7.4 miles). This helps to bring much warmer air mass into the United States, along with moisture.
To put that into perspective, you can see the temperature anomalies on the 10-day forecast below. The warmer ocean air will create a very strong temperature anomaly over much of North America. This also means that the holiday season is going to be warmer than normal across much of the United States.
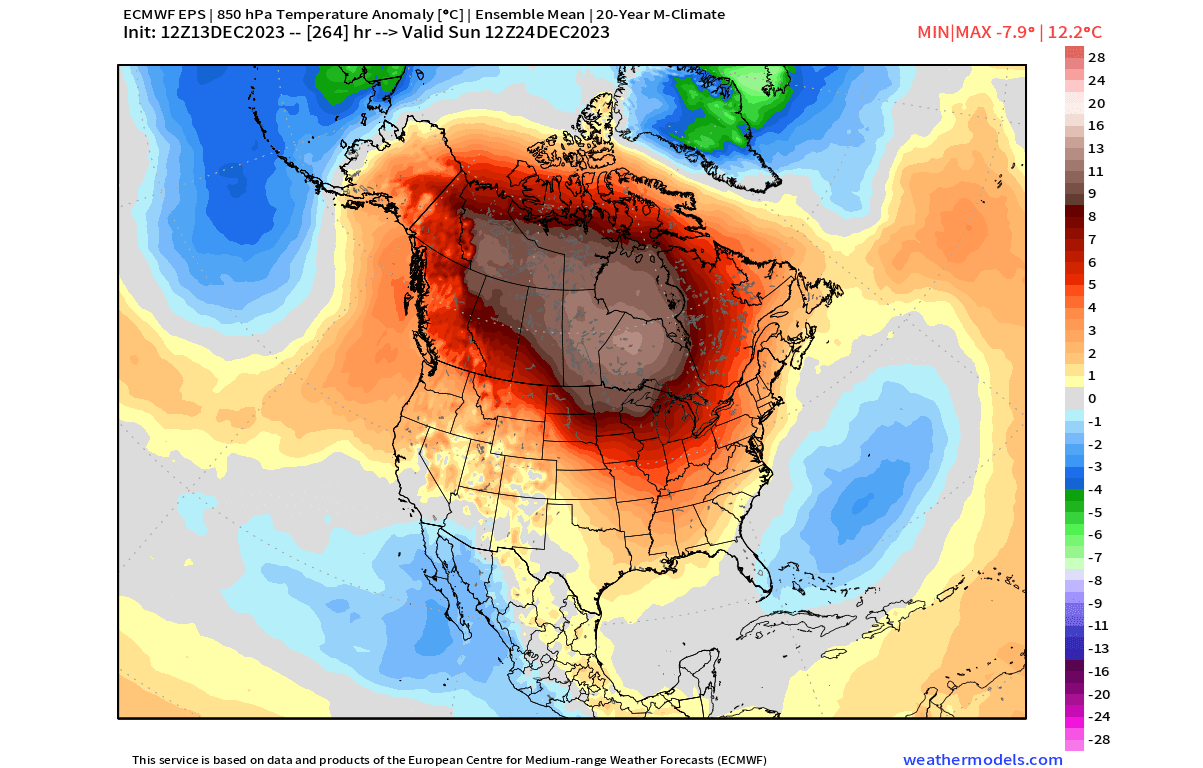
WEATHER FROM THE WEST
As said, the strong westerly flow brings warmer anomalies over the North American continent. Looking closer at the United States, you can see the temperature anomaly in the lower levels. Pretty much the entire country will be under warmer-than-normal temperatures over the holidays.
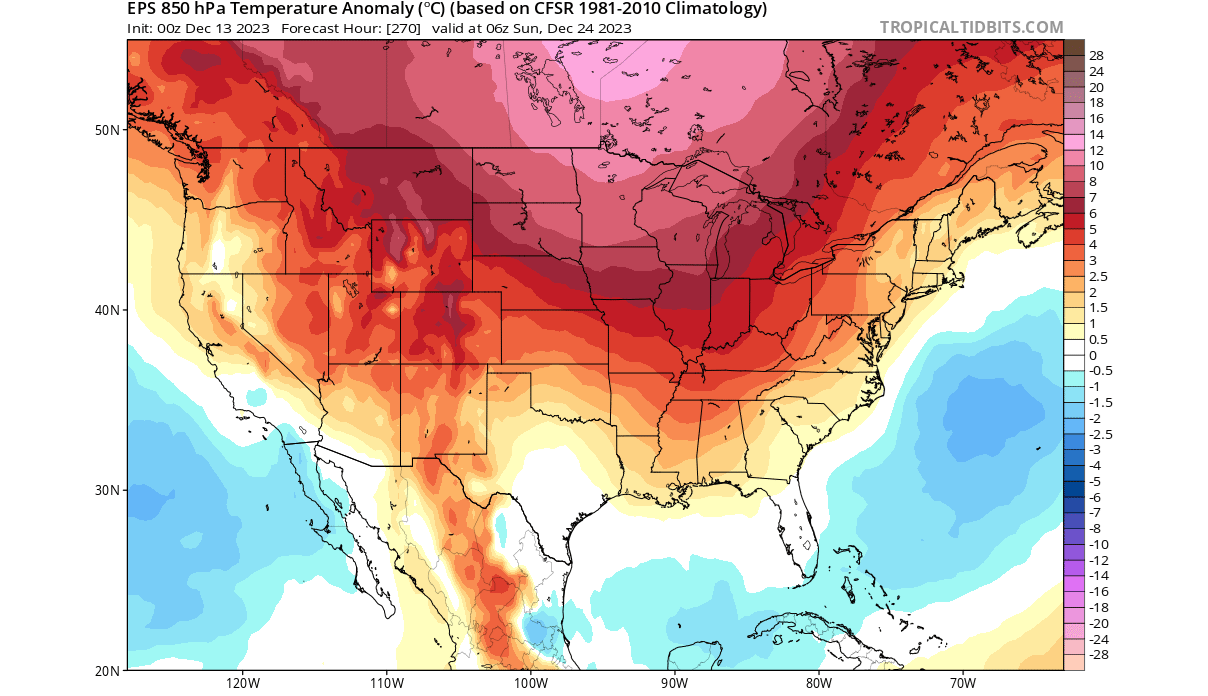
Looking specifically at surface temperatures, you can see the daily temperatures not dropping to freezing levels. The exception is the far northern United States and higher elevations over the Rockies. Of course, Canada is still expected to have below-freezing temperatures, despite the strong warm anomalies, due to its northern location.
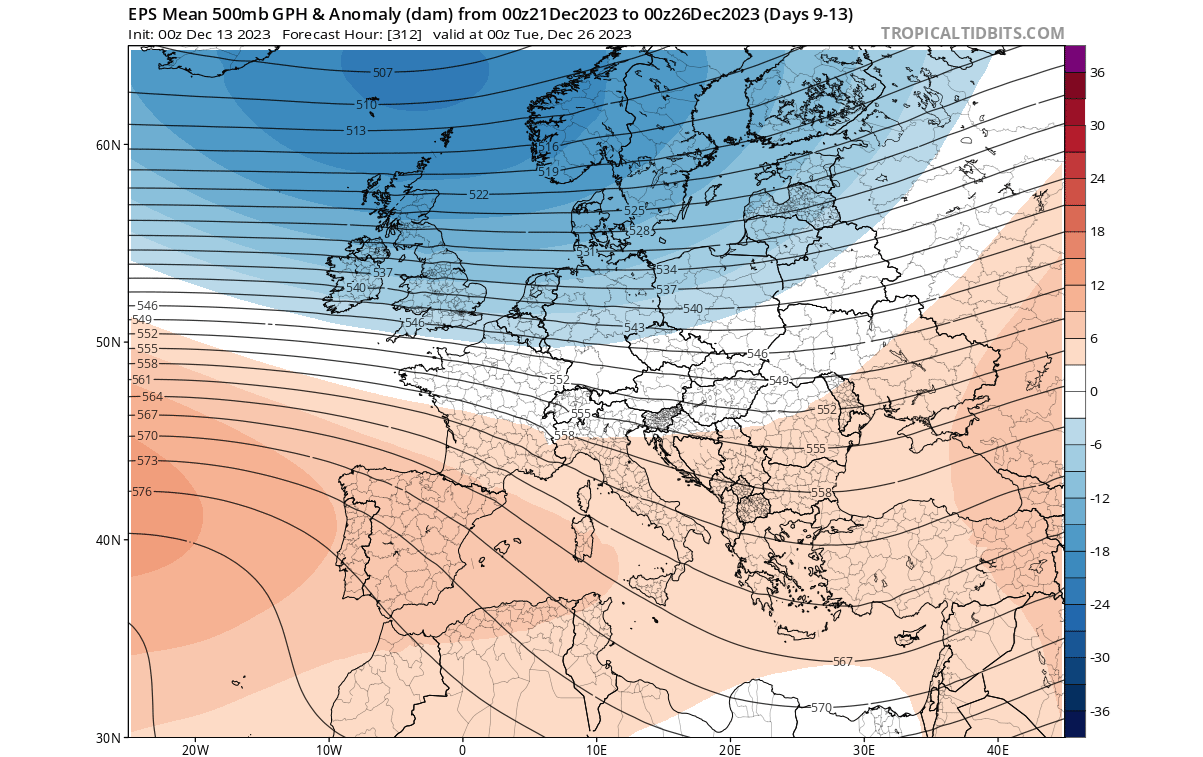
A similar pattern is also seen over Europe, where a low-pressure system over the northern regions drives a milder westerly flow from the Atlantic as it spins counter-clockwise.
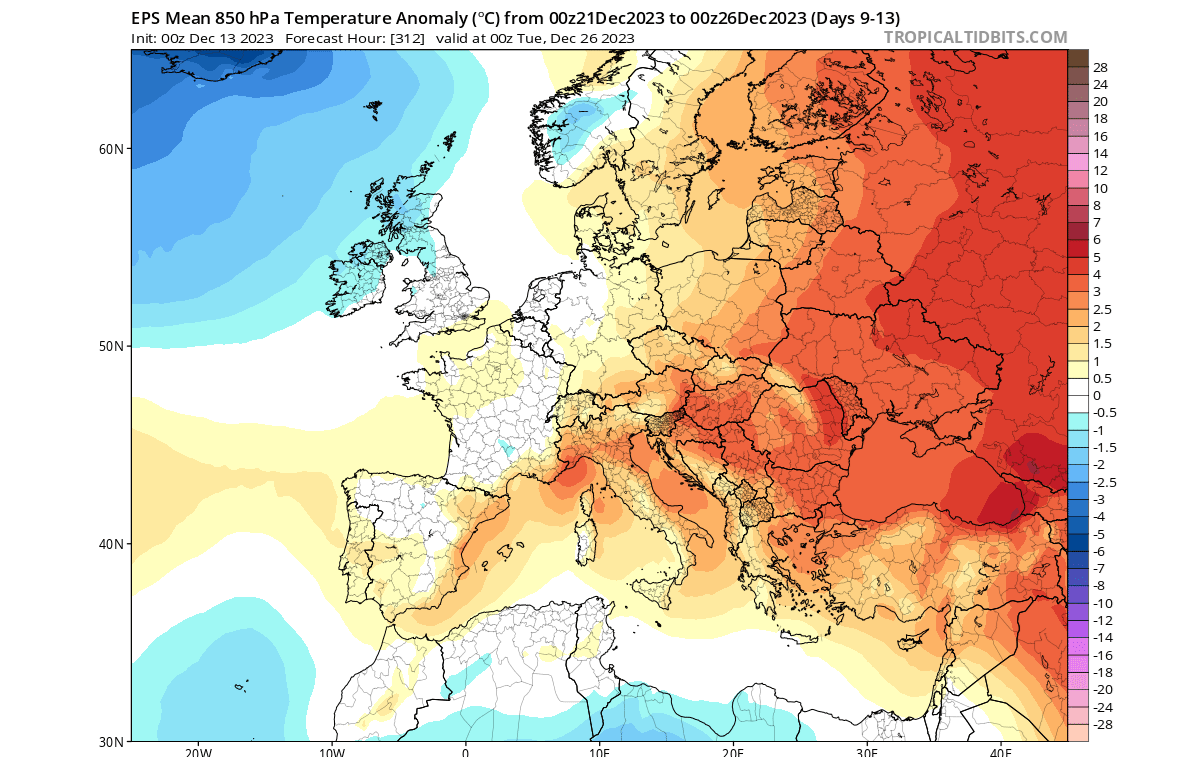
The temperature anomaly forecast over Europe is not as strongly warmer as over the United States and Canada, but you can see that it does prevent any major cold air outbreaks or long-lasting northerly flows into the mainland.
The NOAA 8-14 day temperature outlook sums up this forecast period for the United States. Warmer than normal weather is predicted over much of the country, leading into the final week of December.
A strong jet stream also brings a lot of moisture from the ocean into the United States. In the NOAA precipitation forecast below for the same period, you can see much above-normal precipitation over the western and southern parts of the United States.
But if you like winter and snow, and these images make you feel sad, don’t worry. There is more winter still to come, both on the calendar and, as you will see, also in the atmosphere.
WINTER CHANGE IN JANUARY
Looking at the ensemble forecast, we can see changes in the weather patterns starting around the new year. In the image below, you can see the North Pacific low-pressure area pulling up to the north, allowing the high-pressure area over Canada to back off to the west and north.
That enables the low-pressure area to take over the central and eastern United States, like an undercut below the high-pressure area. It is still just waves of pressure anomalies, like we showed you in the beginning, interacting with each other.
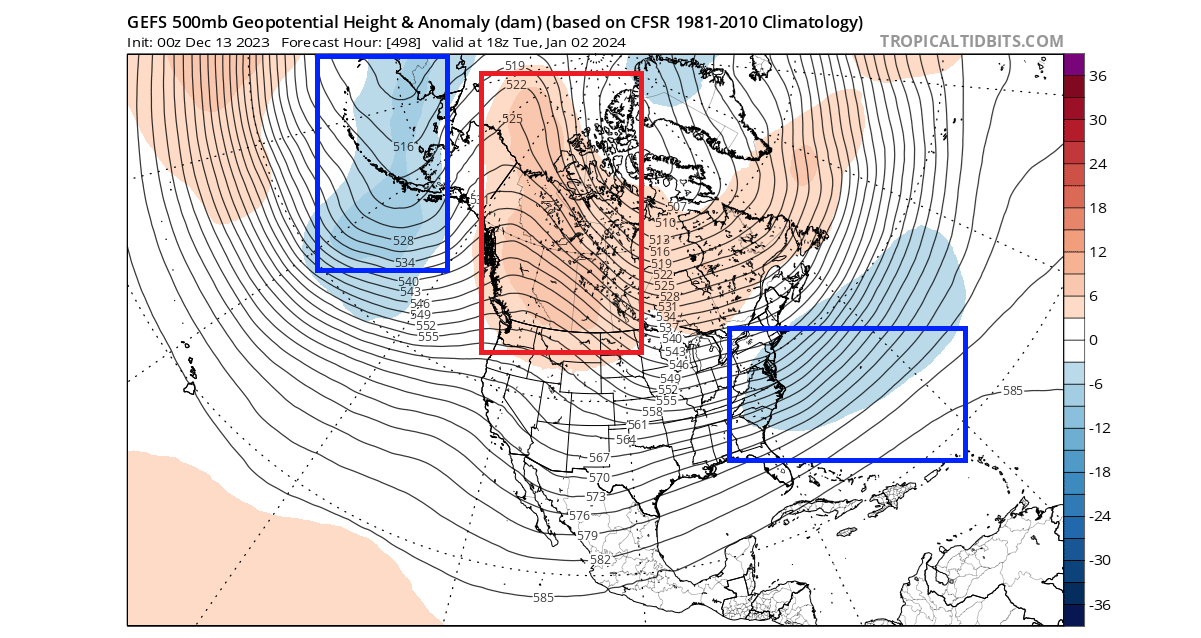
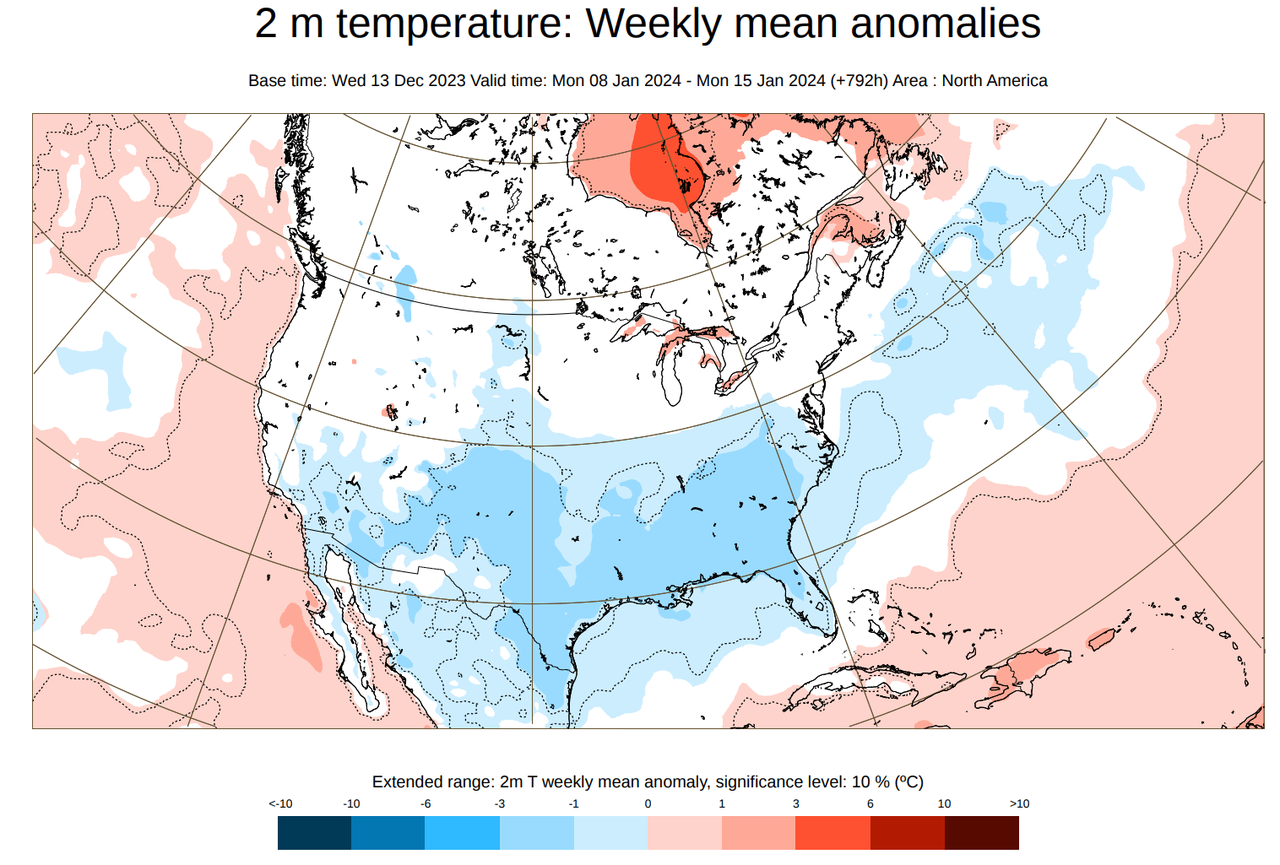
The major changes are then indicated for the second week of January, as seen in the image below. This pressure pattern from the extended ECMWF forecast brings along completely different daily weather. You can see a broad low-pressure area covering much of the United States.
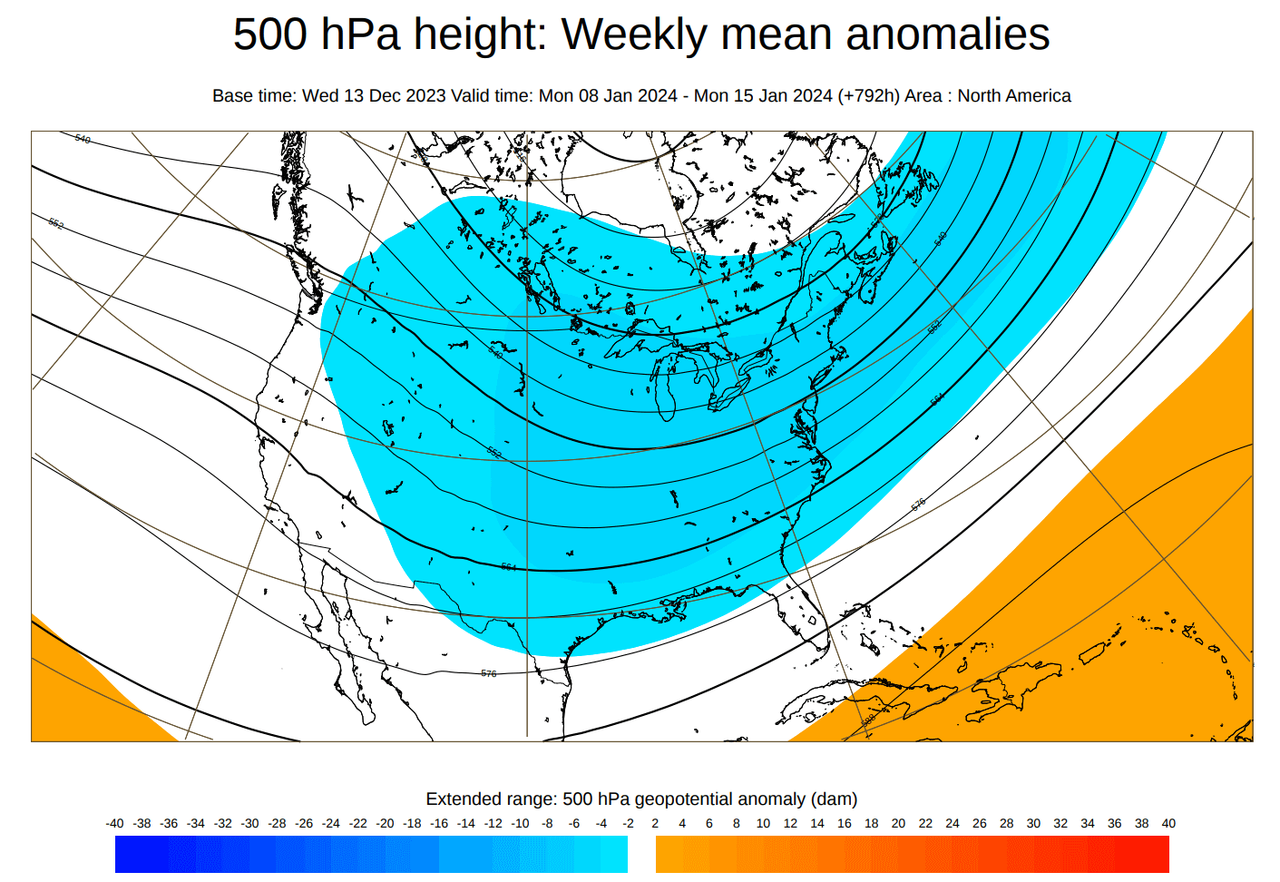
The temperature forecast below, for the same period, shows broad cold anomalies across much of the central, southern, and eastern United States. This indicates the westerly flow is being replaced by a colder northerly flow. Compared to what we will see in the next two weeks, such pattern change would be very welcome in early 2024 if you wish for colder weather and some snowfall.
Looking at the GEFS model for the same period, it shows the exact same temperature pattern. It is perhaps a bit earlier with the colder air than the ECMWF, but at this extended range, the main point is that both (different) models agree on the same outcome, which is a rare sight.
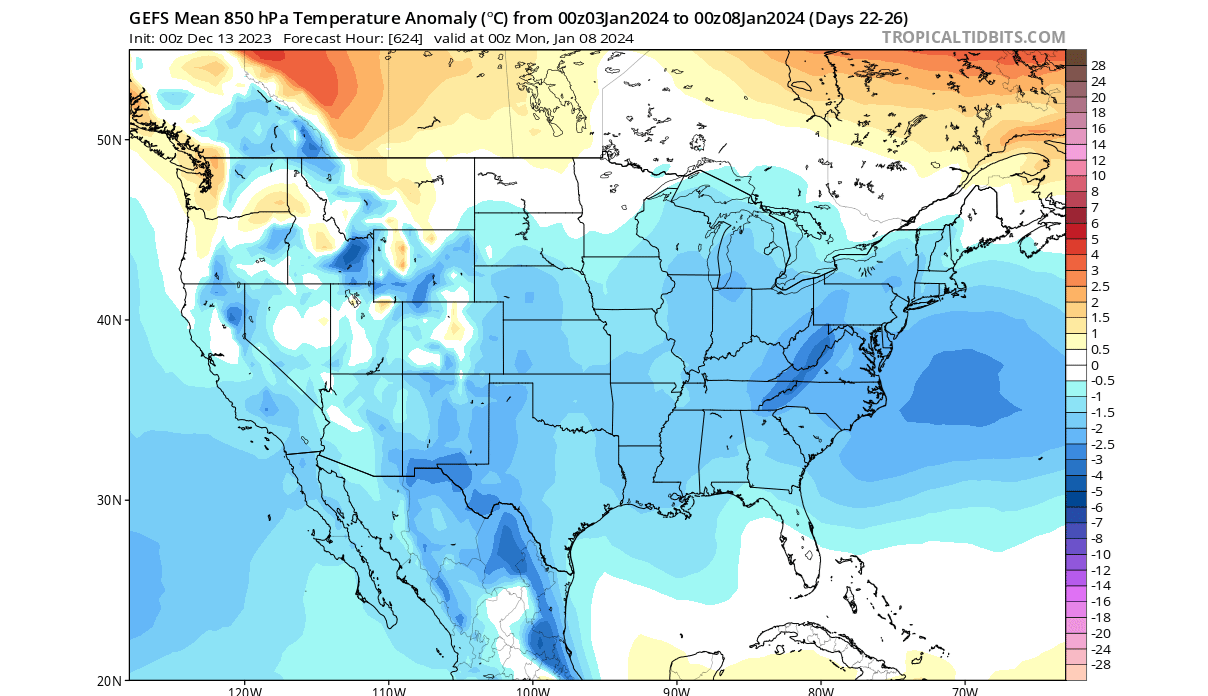
A similar agreement of different models is also seen in the monthly/seasonal forecast, which is an even bigger feat.
JANUARY MONTHLY FORECAST
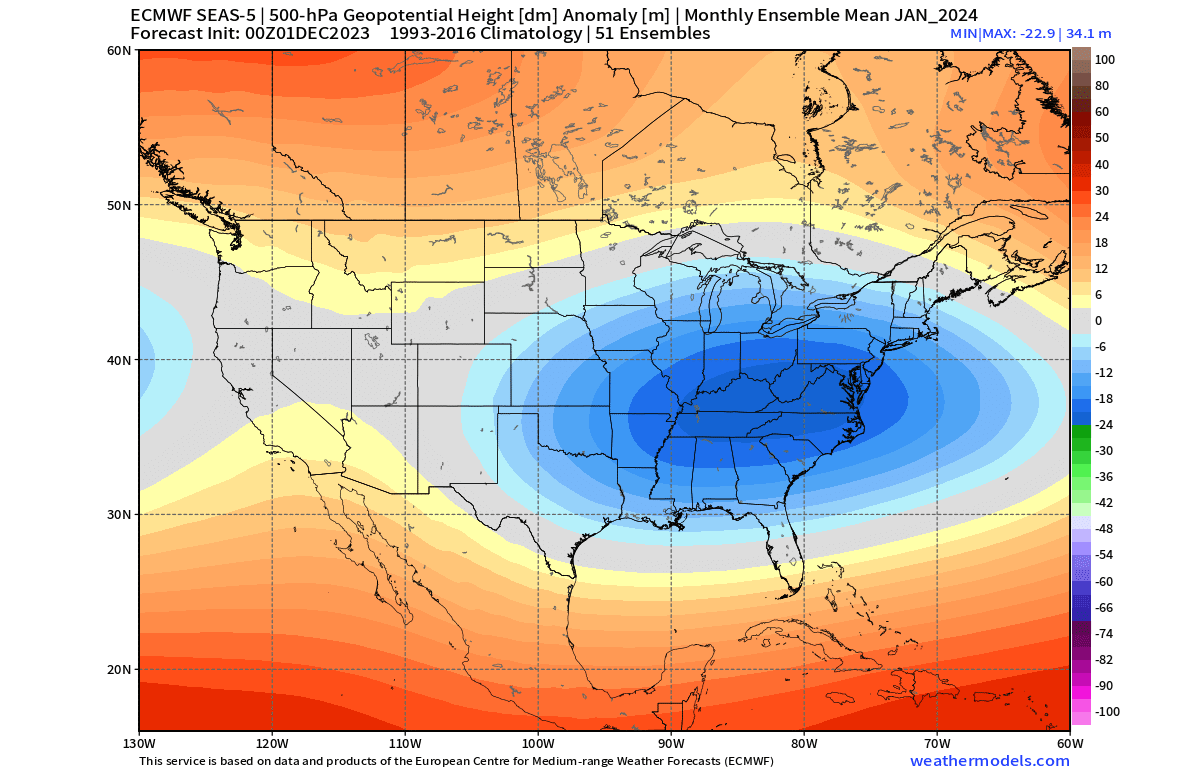
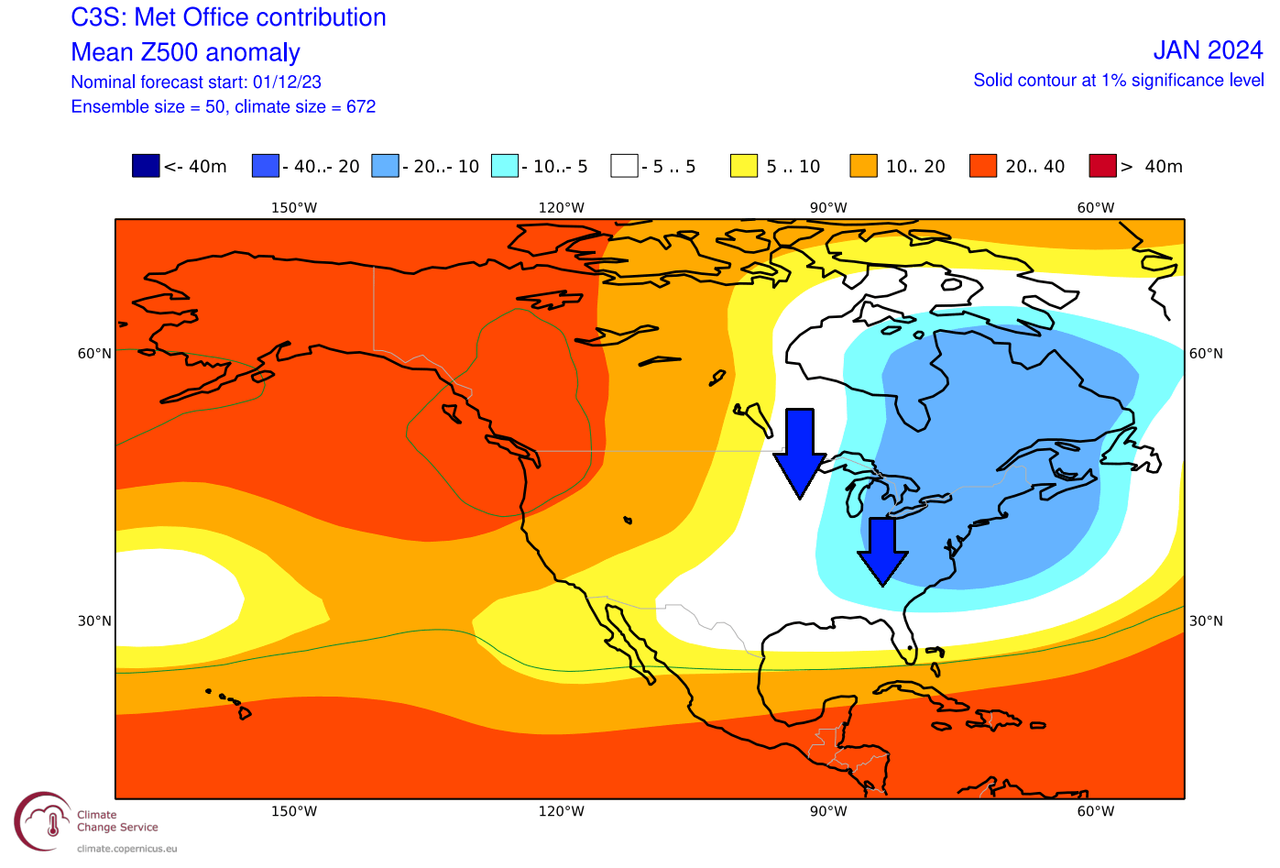
These pressure changes were already indicated in the monthly January pressure forecast last week. Below, you can see a broad low-pressure system across the eastern and central United States. This is in pairing with a high-pressure zone over southern Canada and a ridge over the western United States.
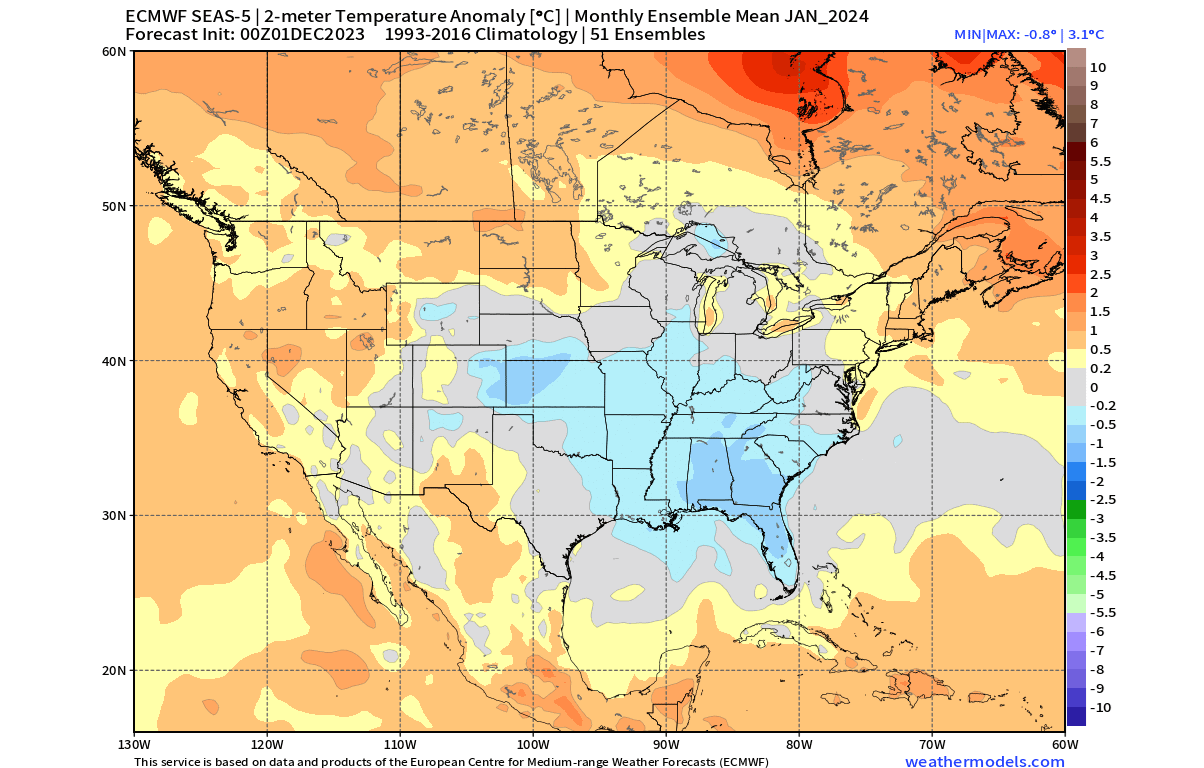
In the January temperature forecast, you can see the cold air anomaly over the central Plains, upper Midwest, and much of the eastern United States. Southern Canada and the western United States are warmer than normal due to the high-pressure influence.
Another model that agrees with this solution is the UKMO. Below is its pressure anomaly forecast for January over North America. It also shows a broader low-pressure area over the eastern United States and Canada, enabling a more northerly airflow.
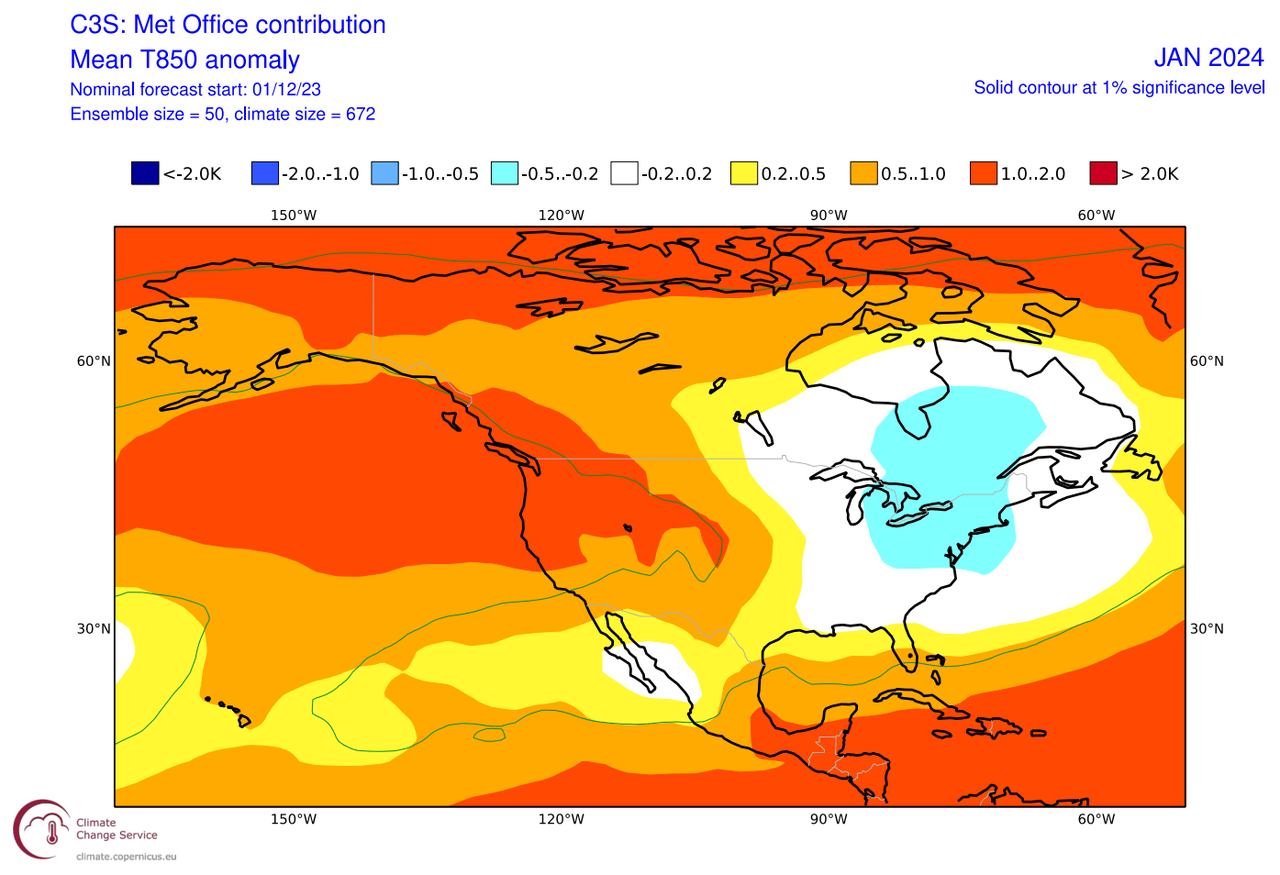
This is reflected in the lower atmosphere temperature anomaly forecast for January, which shows the main colder-than-normal area over the eastern United States and southeastern Canada. Just like in the ECMWF, the warmer anomalies remain over the west, under the high-pressure ridge area.
These forecasts are a monthly average, so unlike the weekly forecast above, they cannot show as many extremes. But to see such a pattern change on a monthly average is a very good sign for the weather patterns to actually flip in early 2024.
ADVERTISEMENT
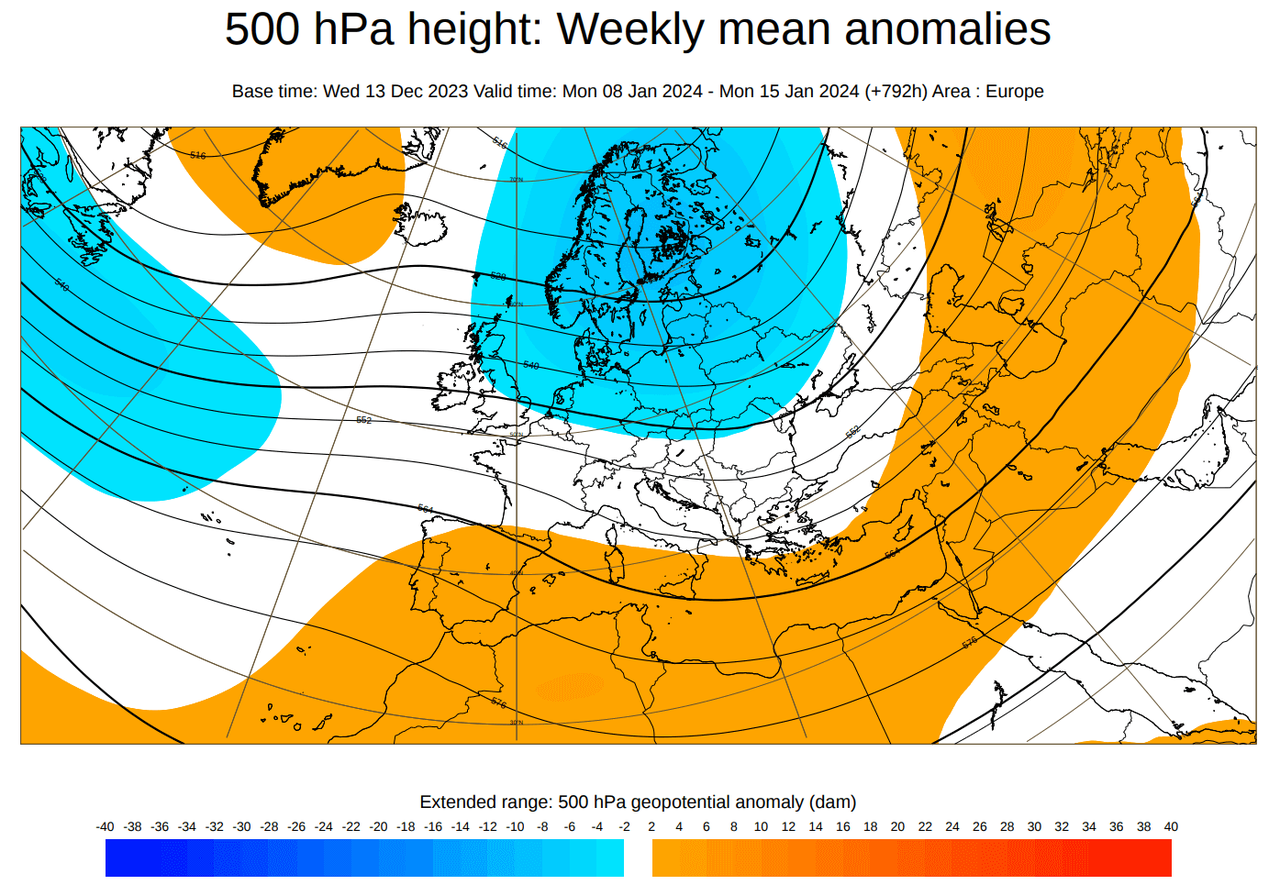
A change is also seen for Europe as we enter January. The weekly pressure anomaly forecast shows a low-pressure area dropping into the central parts. This would at least temporarily weaken the westerly flow and increase the snowfall potential over the central and northern parts.
Looking at the temperature forecast, that cold anomaly is nowhere to be found except for the far northern parts. This is interesting and is not really consistent with what the pressure pattern suggests.
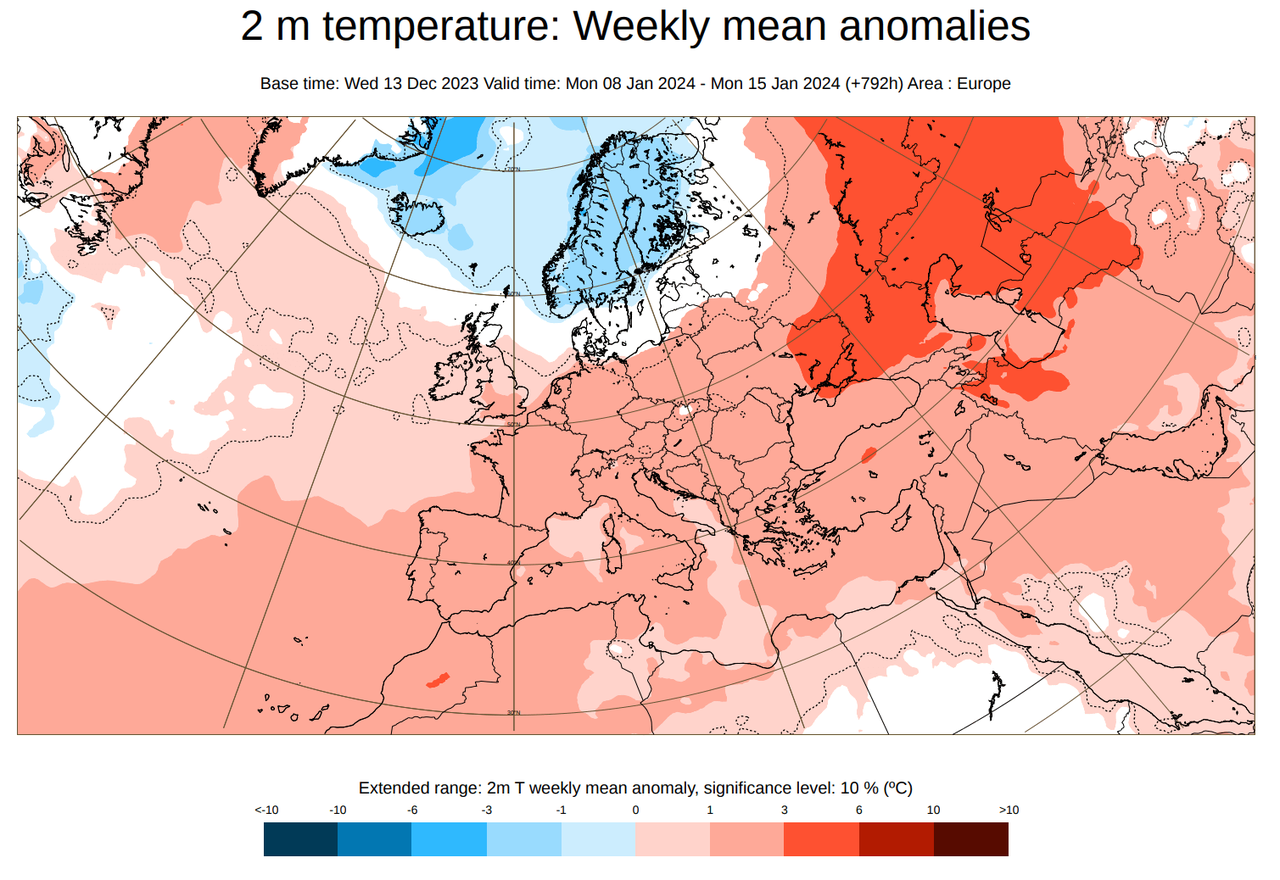
We do have to add that forecasts for Europe do tend to have some irregularities in the extended range, as the drivers behind the weather patterns tend to have a less direct impact than over North America.
But who are these “drivers,” and why do we even have such large swings from red-hot forecast maps to sudden changes into colder patterns?
The answer is not so simple, as we have ocean anomalies, the Polar Vortex, MJO, etc… But there is one major factor this winter that has an important influence on the jet stream and, thus, on the daily weather over the United States and Canada.
As you have probably heard before, that is the strong El Niño event in the Pacific Ocean. We will look at El Niño in this article, as it is directly related to the upcoming jet stream development.
EL NINO WEATHER GAMES
El Niño Southern Oscillation (or ENSO) is a region of the equatorial Pacific Ocean that periodically changes between warm and cold phases. Typically, there is a change around every 1-3 years from one phase to another.
We are currently in a warm phase called El Niño, which is expected to last into Spring 2024.
Below is also an ocean surface anomaly forecast for the January-March period. You can see the El Niño anomaly marked in the tropical Pacific. The forecast shows a basin-wide event of a strong magnitude.
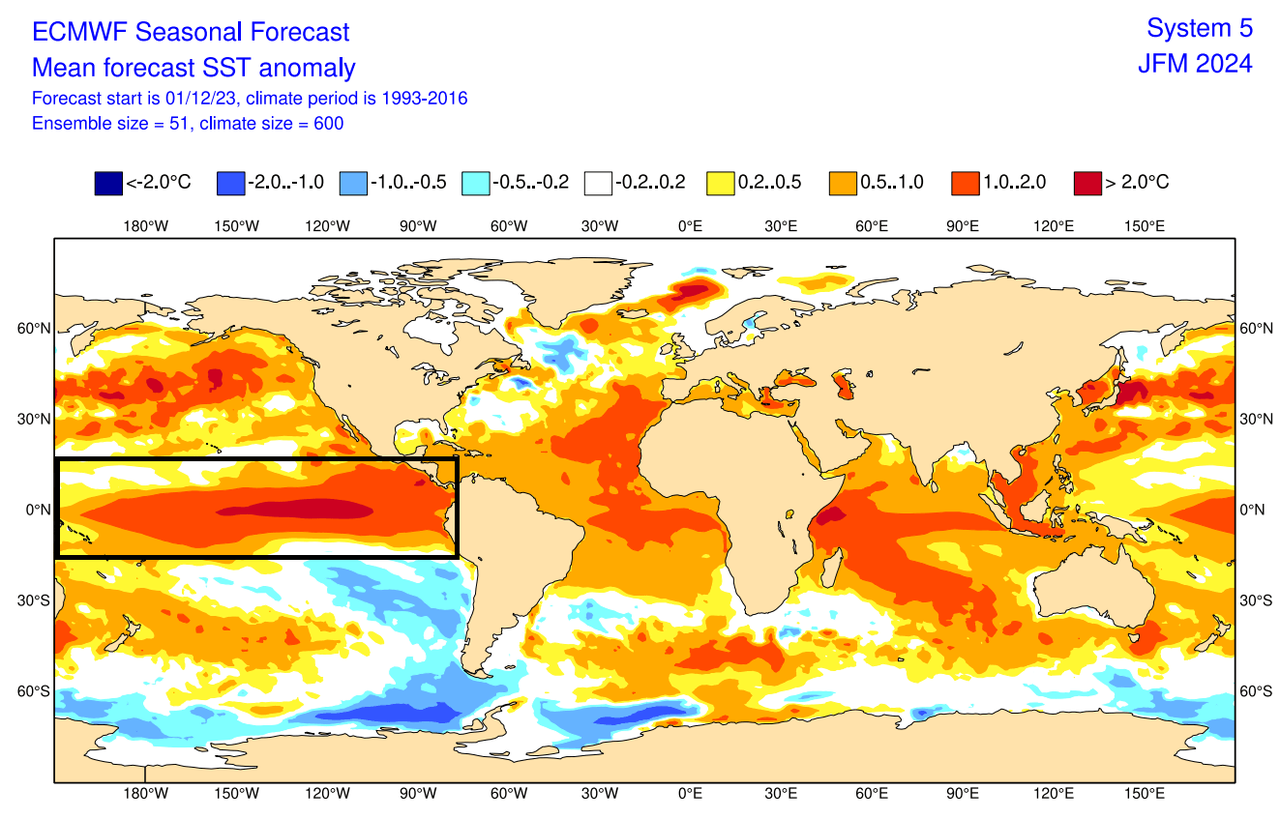
This development is important because changes in ocean temperatures also bring along changes in pressure and precipitation patterns in the tropics. And through those changes, the impact of the El Niño event is distributed into the global circulation.
Below, you can see the average El Niño winter pressure anomalies. Notice the strong low-pressure anomaly in the North Pacific, exactly like we have seen in the forecast for the rest of December. Also, you can see the high-pressure area over Canada and the northern United States
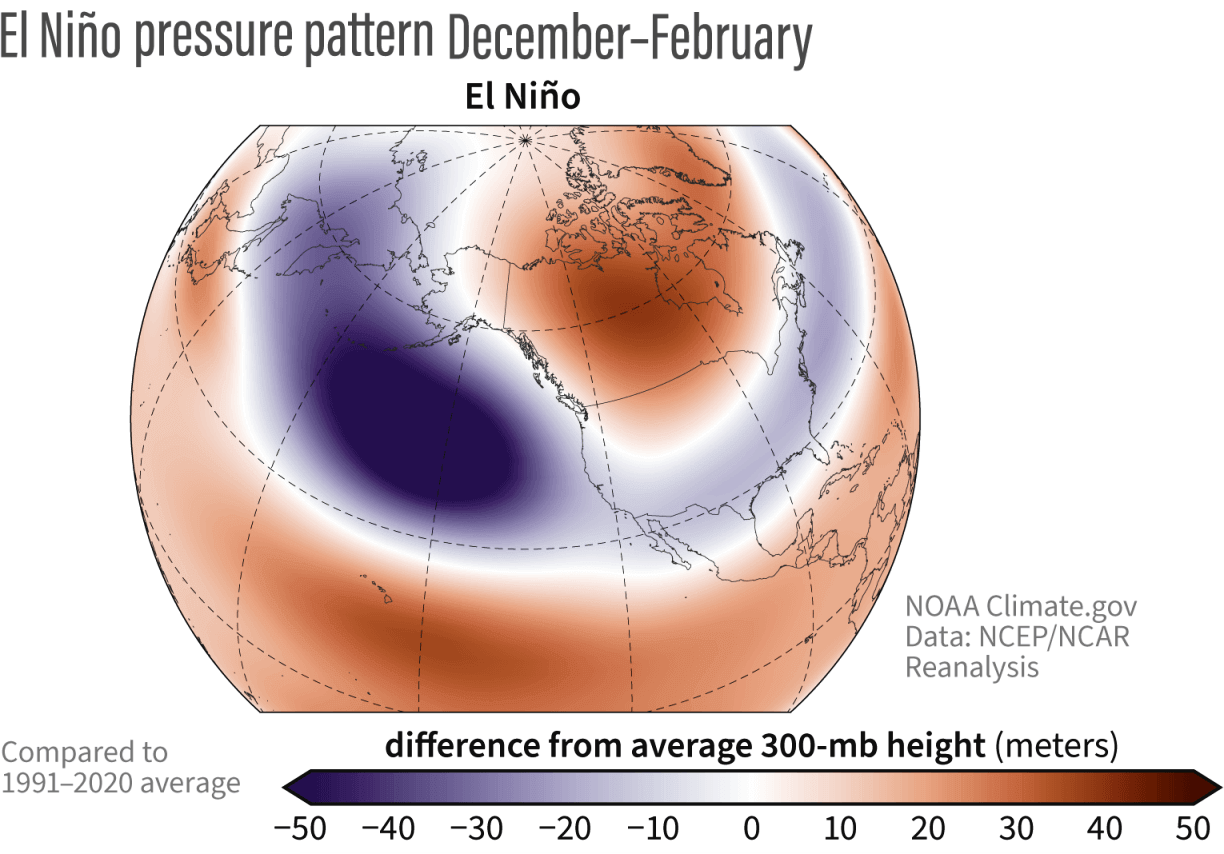
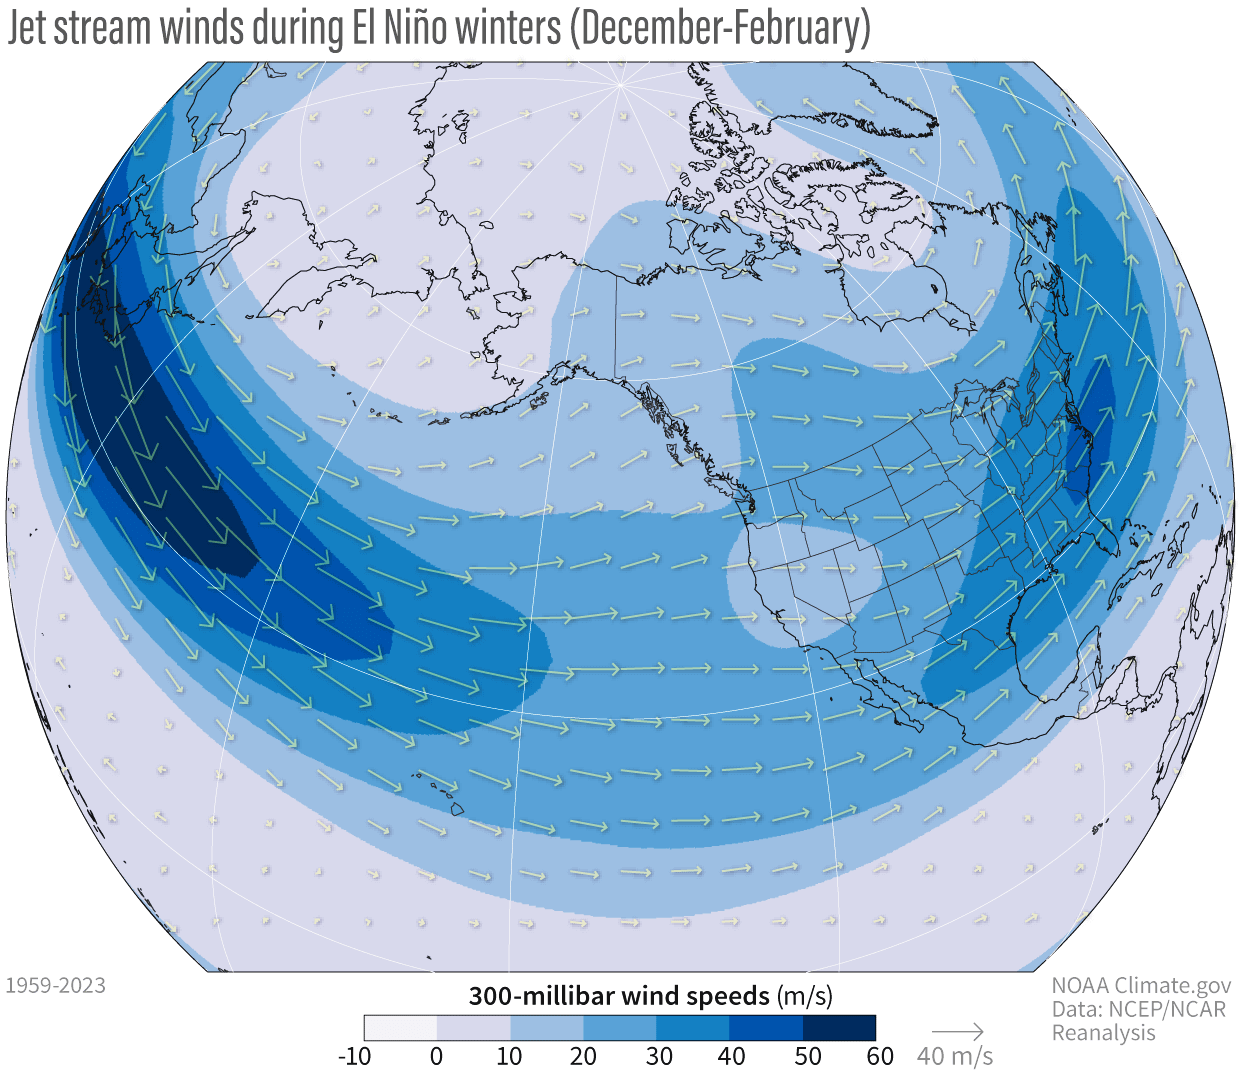
This shows with confidence that the upcoming warm pattern is to be expected in El Niño winters. That is also evident when you see the image below, which shows the typical jet stream pattern in such winters. You can see an amplified subtropical jet stream. This is the same pattern that will impact the weather over North America in the next two weeks.
We can see all this info combined in the next NOAA image below, indicating the average weather during the El Niño winter season.
You can see the strong and persistent low-pressure area in the North Pacific. That pushes the polar jet stream further north, bringing warmer-than-normal temperatures to the northern United States and western Canada.
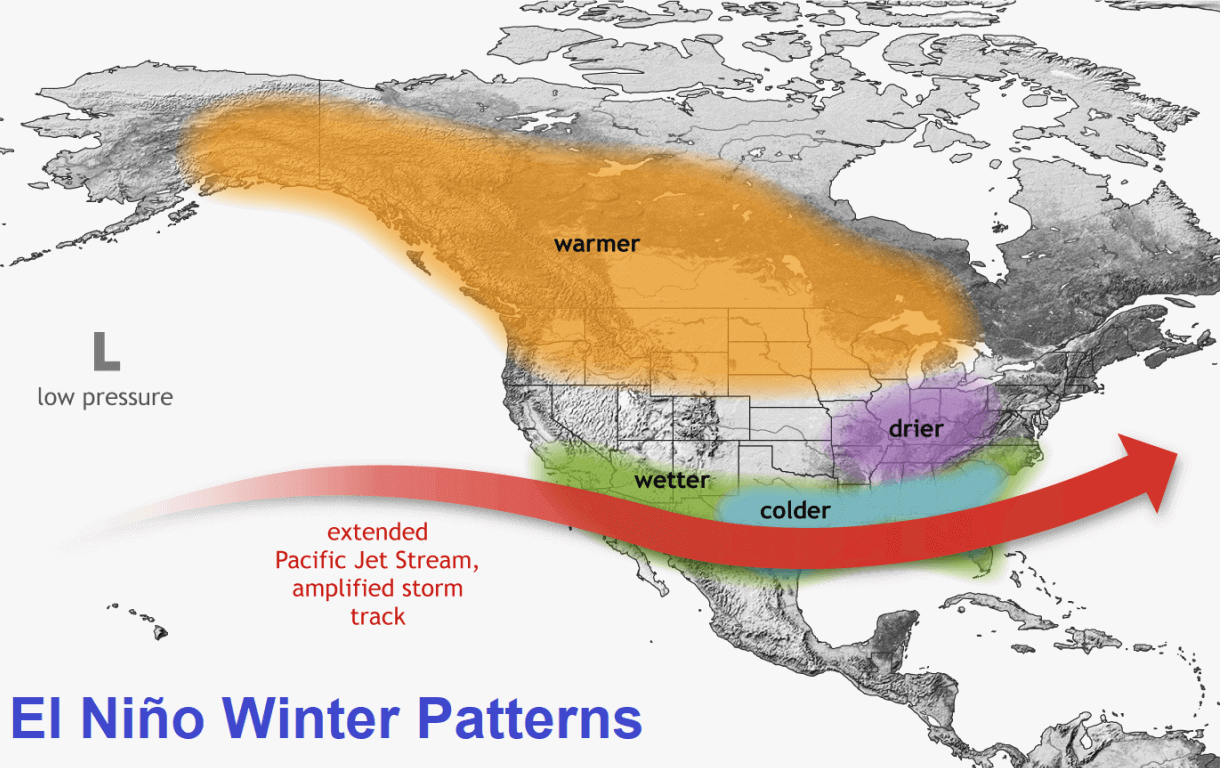
The southerly Pacific jet stream is extended and amplified during an, bringing low pressure and storms with lots of precipitation and cooler weather to the southern and southeastern United States.
This is slightly different than what we will see in the next weeks, but notice that the image above is a seasonal average. It shows data from 3 months or more.
If you consider the change to a colder weather pattern in January, the overall long-term average might end up looking very close to the typical El Niño winter.
Below is the temperature analysis by NOAA, which shows the number of past El Niño events that were more often warmer or colder. It reveals that during these events, the winters are more often colder than average across the southern half of the United States and up into the northeast.
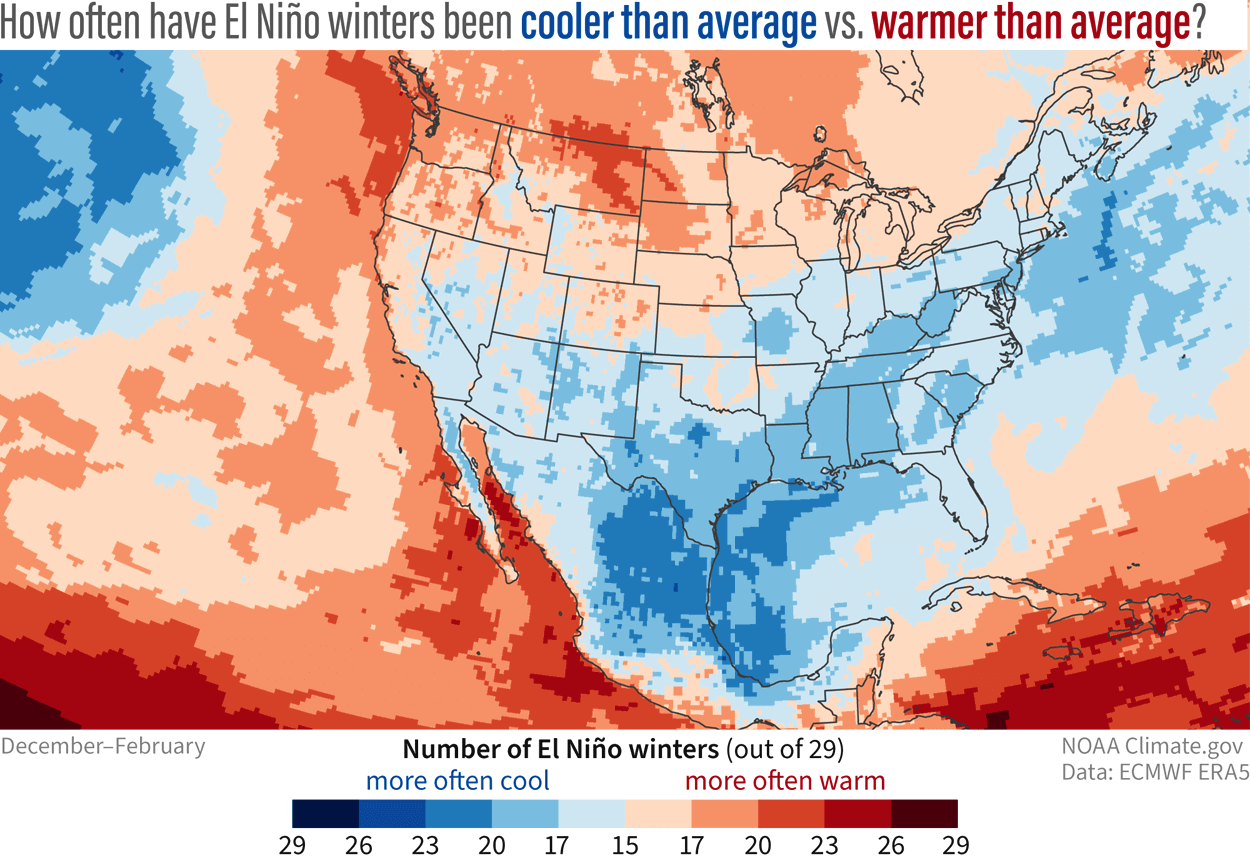
This shows the 3-month average, which means that there is an overall tendency to have periods of colder weather across the eastern and northeastern United States. And also colder than normal conditions over the southern states.
So, as December ends much warmer than normal, it is very much likely for January and February to fix the seasonal average back to normal with some cold.
You can learn more about the expected winter weather and pressure changes for January and February 2024 in our latest seasonal outlook article:
Authored by Andrej Flis of Severe Weather Europe via Zerohedge.com
More Top Reads From Oilprice.com:
- Russia’s Oil Revenues Slump to the Lowest Level since July
- Exxon Reportedly To Mirror Peers with Cash Bonuses for Risk Traders
- Houthis Continue To Attack Ships Near Vital Oil Chokepoints

ZeroHedge
The leading economics blog online covering financial issues, geopolitics and trading.
Related posts


-
![]() George Doolittle on December 17 2023 said:Massive tropical storm hitting to Sunday middle December, 2023 so definitely a surprise with all of this. If South Carolina had spent their billions on building out wind energy instead of nuclear power there would be so much electricity here they wouldn't know what to do with it all.
George Doolittle on December 17 2023 said:Massive tropical storm hitting to Sunday middle December, 2023 so definitely a surprise with all of this. If South Carolina had spent their billions on building out wind energy instead of nuclear power there would be so much electricity here they wouldn't know what to do with it all.


Open57.81
Trading Vol.6.96M
Previous Vol.241.7B